
Since Netflix has been dominating all the straemaing platforms, several months ago decided to analyze the releasing titles nationality. This was possible by using several rstats libraries and the released dataset on the TidyTuesday project.
Data import
Released titles in 2020
(
movies_country_year <- netflix_titles |>
  select(country, release_year, type) |>
  filter(release_year == 2020, !is.na(country)) |>
  separate_rows(country, sep = ", ") |>
  count(country = fct_lump(country, 10), sort = TRUE, type) |>
  filter(country != "Other")
)ggplot(movies_country_year, aes(n, reorder(country, n), label = n, fill = type)) +
geom_col(alpha = 0.7, width = 0.7, position = "dodge2") +
geom_text(size = 3, color = "white", position = position_dodge(width = 0.8), hjust = -1) +
labs(
y = "",
x = "",
title = "Released titles in 2020 available in Netflix",
subtitle = "Frequency of movies releases during 2020 (the pandemic) per country, that are available in Netflix \n(Date do not correspond to Netflix release, but to the movies theirselves)",
caption = "Data: Kaggle \n#TidyTuesday: 2021-04-17 \nPlot: @Gaspardelanoche"
) +
theme(
plot.background = element_rect(fill = "#111111"),
panel.grid = element_line(color = "#333333", linetype = "dotted", size = 0.2),
panel.background = element_rect(fill = "#111111"),
axis.text.x = element_text(color = "white"),
axis.title = element_text(color = "white"),
axis.text.y = element_text(color = "white"),
axis.line = element_line(color = "#333333"),
axis.ticks = element_line(color = "gray30"),
plot.title = element_text(color = "red", size = 20),
plot.subtitle = element_text(color = "white", size = 13),
plot.caption = element_text(color = "white", size = 11),
legend.text = element_text(color = "white"),
legend.background = element_rect(fill = "#111111"),
legend.position = "bottom",
legend.title = element_blank()
) +
scale_fill_manual(values = c("#FAF5FF","#FF0000"))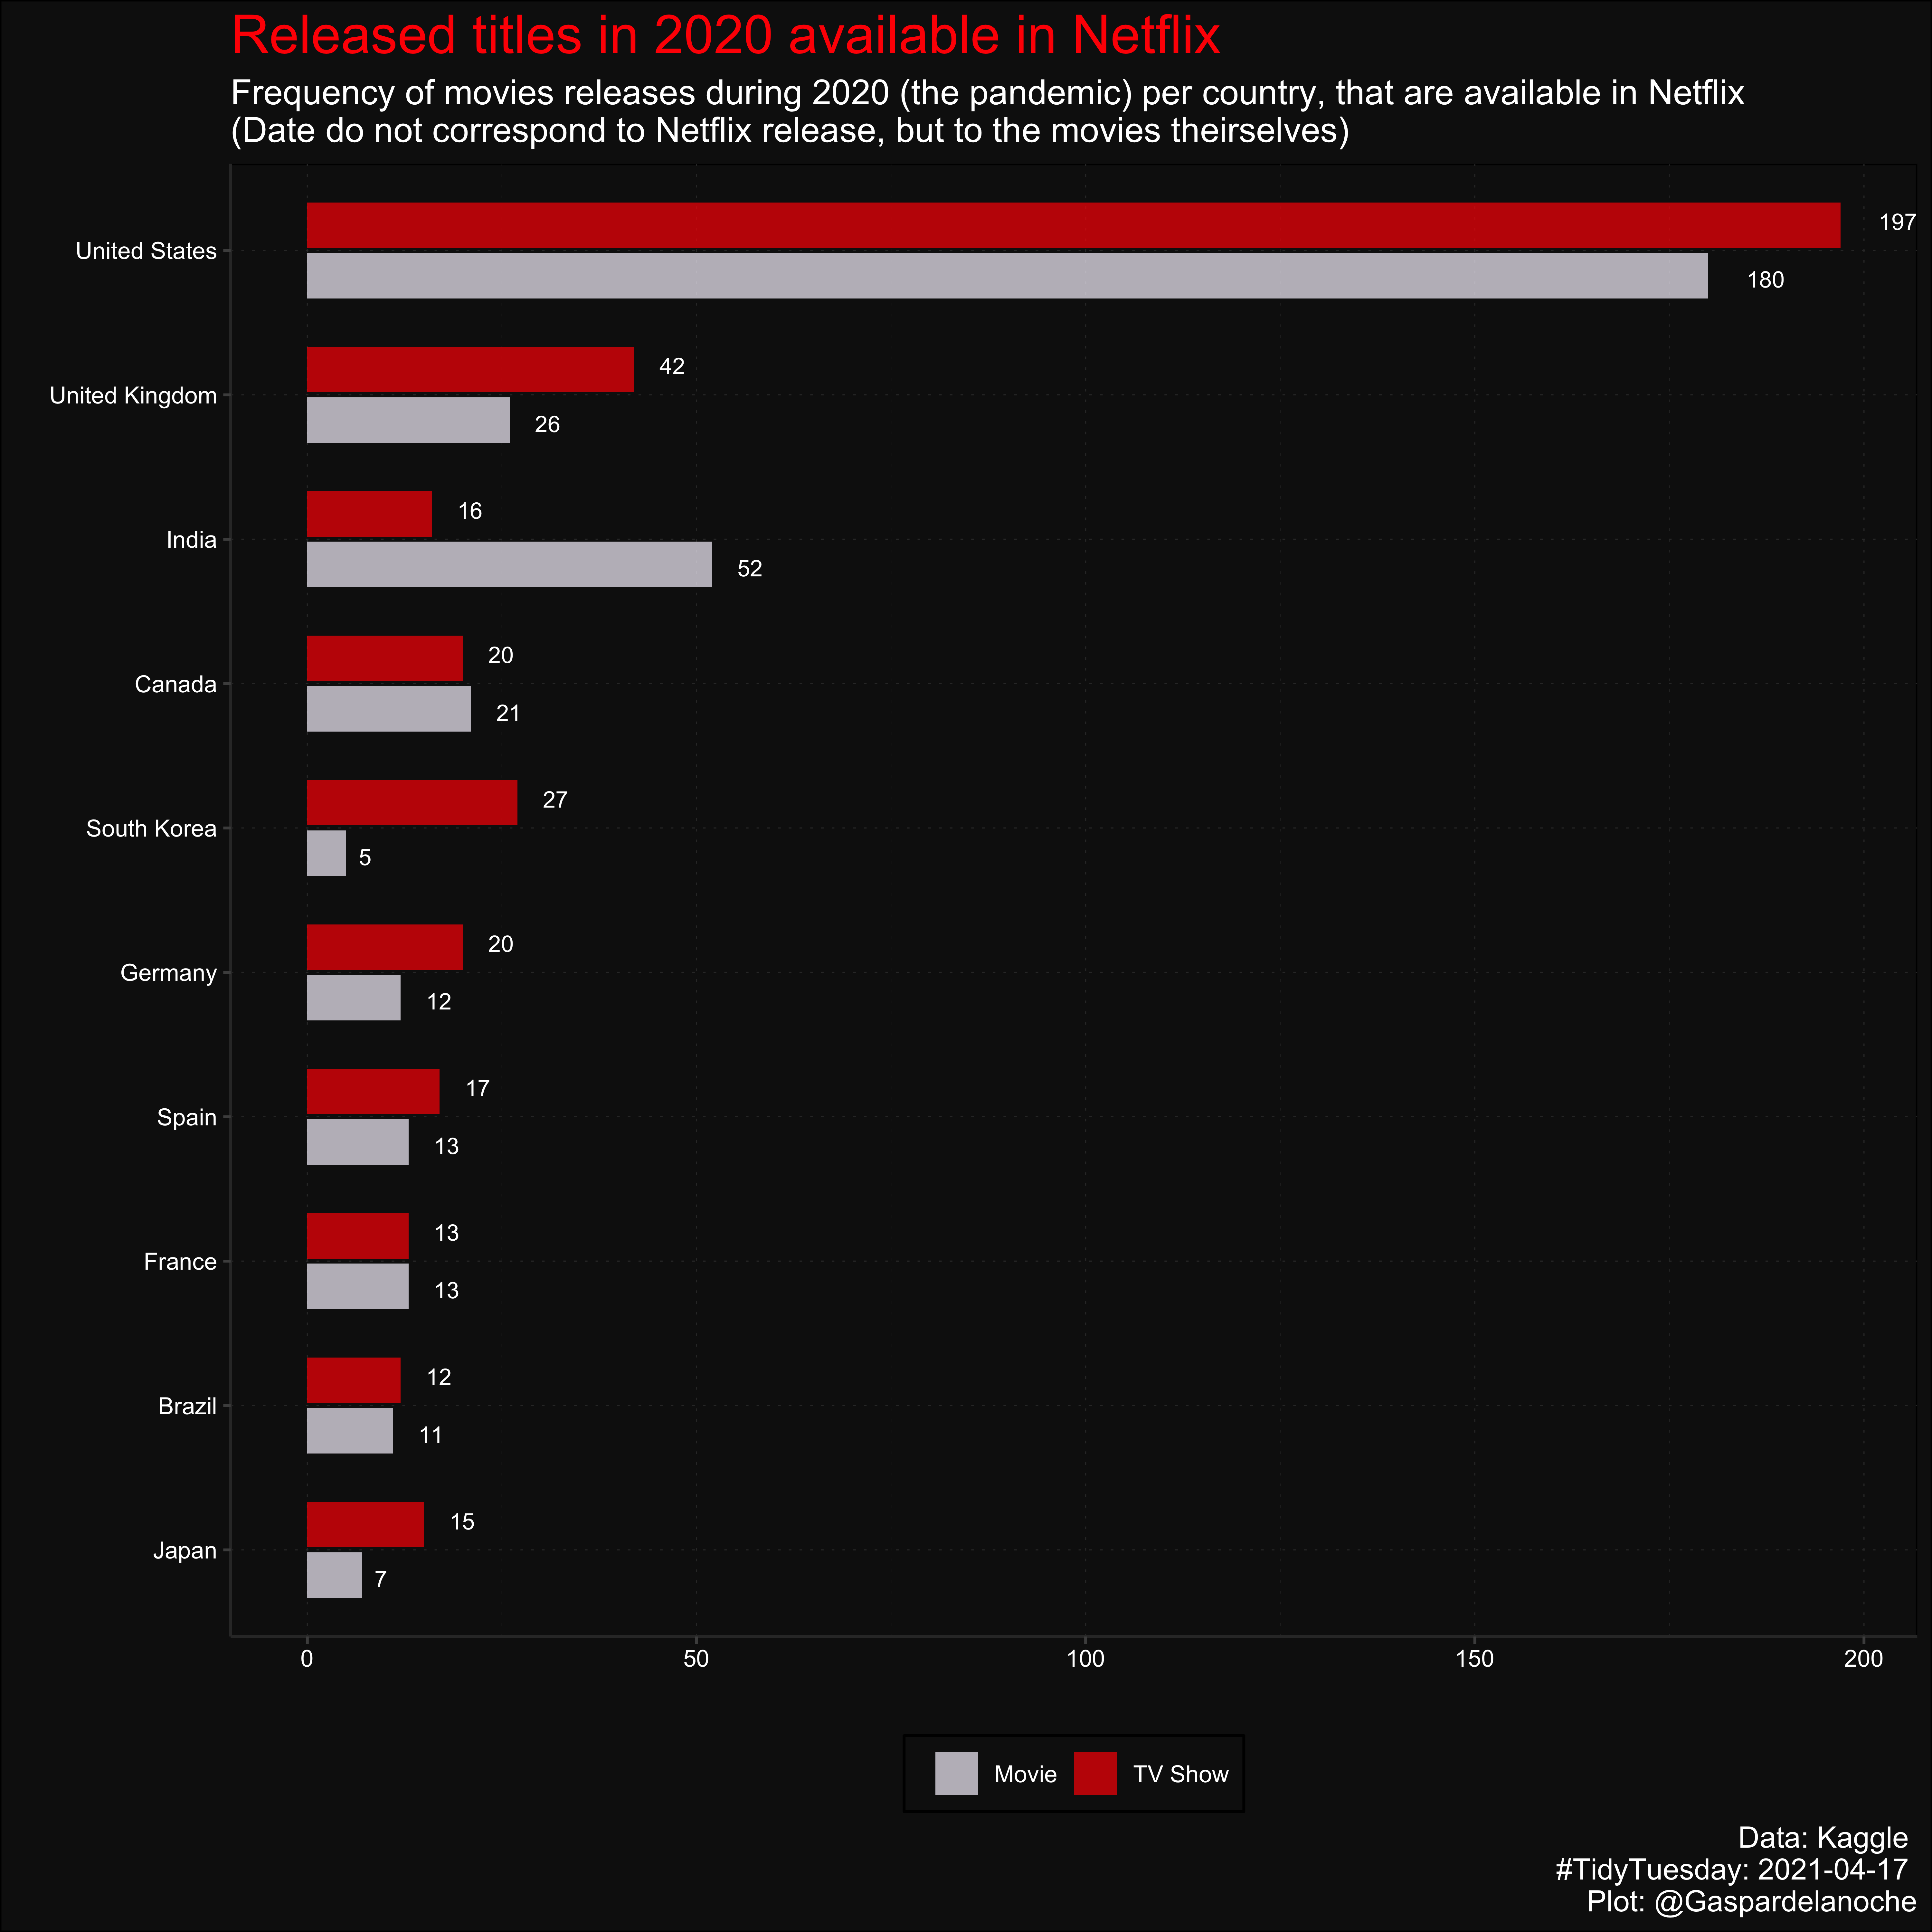
Releases titles animated
(
movies_country_years <- netflix_titles |>
  select(country, release_year, type) |>
  filter(!is.na(country), !is.na(release_year)) |>
  separate_rows(country, sep = ", ") |>
  count(country = fct_lump(country,10), sort = TRUE, release_year) |>
  pivot_wider(names_from = release_year, values_from = n) |>
  # mutate(vars("2018":"2011"), ~ if_else(is.na(.), '0', .))
  mutate(across(everything(), ~replace_na(., 0)))
  # pivot_longer(!c(country,), names_to = "release_year",  values_to = "n") |>
  # filter(country != "Other") |>
  # group_by(country) |>
  # arrange(release_year) |>
  # summarize(release_year, cumsum = cumsum(n), n, .groups = "drop") |>
  # # ungroup() |>
  # group_by(release_year) |>
  # mutate(ordering = rank(cumsum, ties.method = "first"), release_year = as.integer(release_year), cumsum_lab = as.character(cumsum))
)
movies_country_years_animated <- ggplot(movies_country_years, aes(ordering, group = country)) +
geom_tile(aes(y = cumsum/2, height = cumsum, width = 0.9), alpha = 0.5, fill = "red") +
geom_text(aes(y = 0, label = country), hjust = 1.1, color = "white") +
geom_text(aes(y = cumsum, label = cumsum_lab), size = 3, color = "white", hjust = -0.5) +
coord_flip(clip = "off", expand = FALSE) +
labs(
y = "",
x = "",
title = "Released titles in {frame_time} available in Netflix",
subtitle = "Frequency of movies released in {frame_time} country, that are available in Netflix \n(Date do not correspond to Netflix release, but to the movies theirselves)",
caption = "Data: Kaggle \n#TidyTuesday: 2021-04-17 \nPlot: @Gaspardelanoche"
) +
theme(
plot.background = element_rect(fill = "#111111"),
panel.grid = element_line(color = "#333333", linetype = "dotted", size = 0.2),
panel.background = element_rect(fill = "#111111"),
axis.text.x = element_text(color = "white"),
axis.title = element_text(color = "white"),
axis.text.y = element_blank(),
axis.line = element_line(color = "#333333"),
axis.ticks = element_line(color = "gray30"),
plot.title = element_text(color = "red", size = 20),
plot.subtitle = element_text(color = "white", size = 13),
plot.caption = element_text(color = "white", size = 11),
legend.text = element_text(color = "white"),
legend.title = element_blank(),
plot.margin = margin(4, 4, 4, 4, "cm")
) +
transition_time(release_year) +
ease_aes('bounce-in-out')
gganimate::animate(movies_country_years_animated, nframes = 500, fps = 10, width = 800, height = 800, end_pause = 25)Citation
BibTeX citation:
@online{garcía-botero2021,
  author = {García-Botero, Camilo},
  title = {Netflix Titles Per Country},
  date = {2021-04-30},
  langid = {en}
}
For attribution, please cite this work as:
García-Botero, Camilo. 2021. “Netflix Titles Per Country.”
April 30, 2021.