
data <-  tidytuesdayR::tt_load(2021, week = 7)
student_debt <- data$student_debtUsing the tidytuesdayR package this task is easy:
| year | race | loan_debt | loan_debt_pct |
|---|---|---|---|
| 2016 | White | 11108.410 | 0.3367511 |
| 2016 | Black | 14224.770 | 0.4183588 |
| 2016 | Hispanic | 7493.999 | 0.2189689 |
| 2013 | White | 8363.605 | 0.2845555 |
| 2013 | Black | 10302.660 | 0.4122773 |
| 2013 | Hispanic | 3177.410 | 0.1570289 |
Students debts over time
library(ggplot2)
library(ggprism)

student_debt |>
  ggplot(aes(year, loan_debt, color = race)) +
  geom_line() +
  theme_minimal() +
  theme(
    legend.title = element_blank(),
    axis.line = element_line(color = "#000000"),
    axis.ticks = element_line(color = "#000000"),
    panel.grid = element_line(color = "#DDDDDD", linetype = "dotted"), # Soft gray
    legend.position = "top"
  ) +
  labs(
    x = "",
    y = "Loan debt (USD)"
  ) +
  scale_x_continuous(guide = "prism_offset_minor", limits = c(1990,2015)) +
  scale_y_continuous(guide = "prism_offset_minor", limits = c(1000, 10000))
Warning: Removed 9 row(s) containing missing values (geom_path).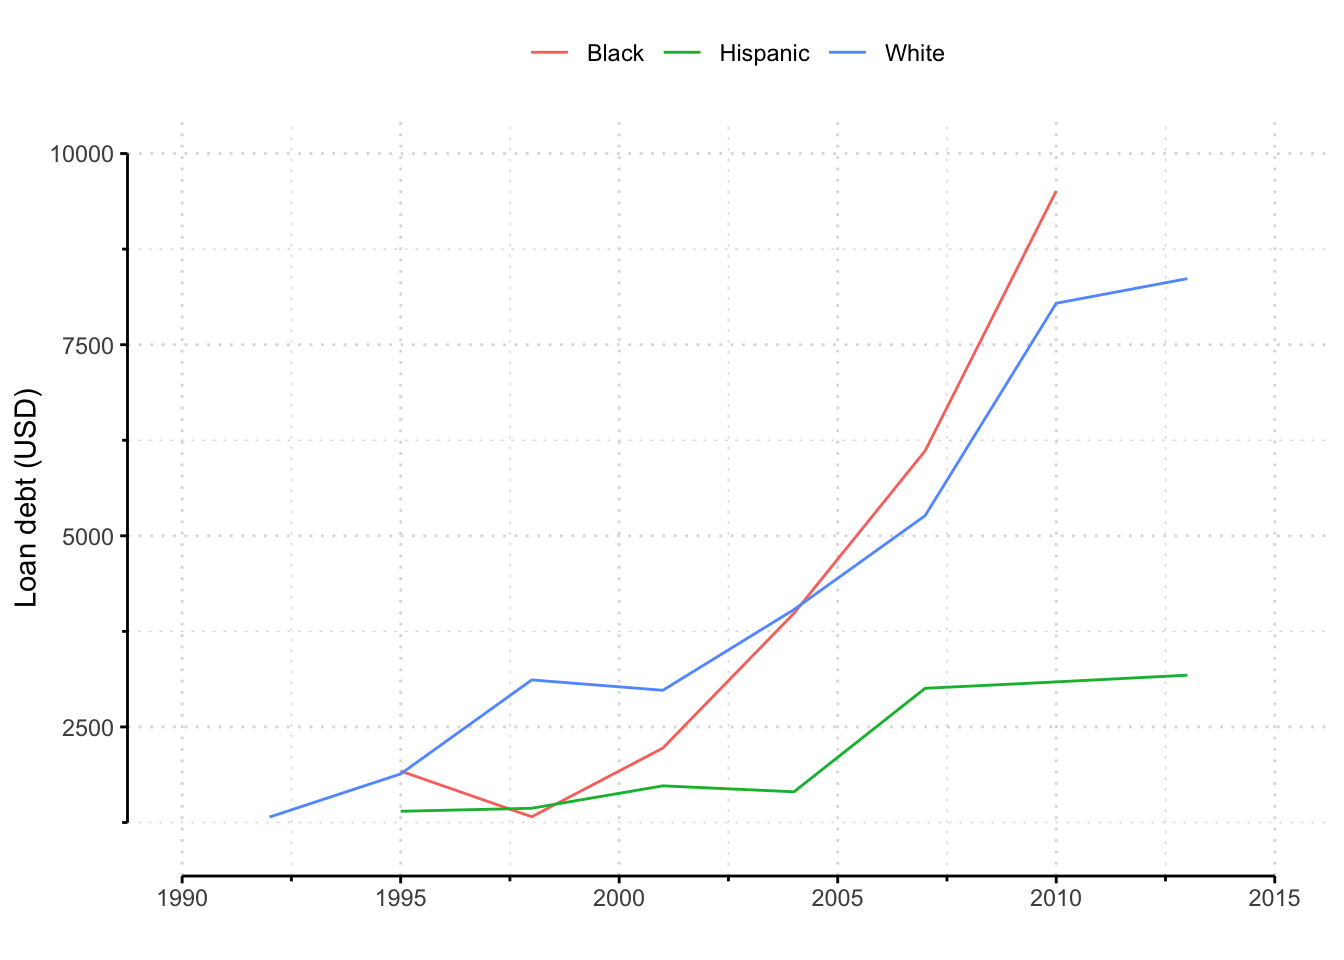
Citation
BibTeX citation:
@misc{garcía-botero2021,
  author = {García-Botero, Camilo},
  title = {How Do Students’ Loans Change over Time?},
  date = {2021-02-09},
  url = {https://camilogarciabotero.github.io/blog},
  langid = {en}
}
For attribution, please cite this work as:
García-Botero, Camilo. 2021. “How Do Students’ Loans Change over
Time?” https://camilogarciabotero.github.io/blog.