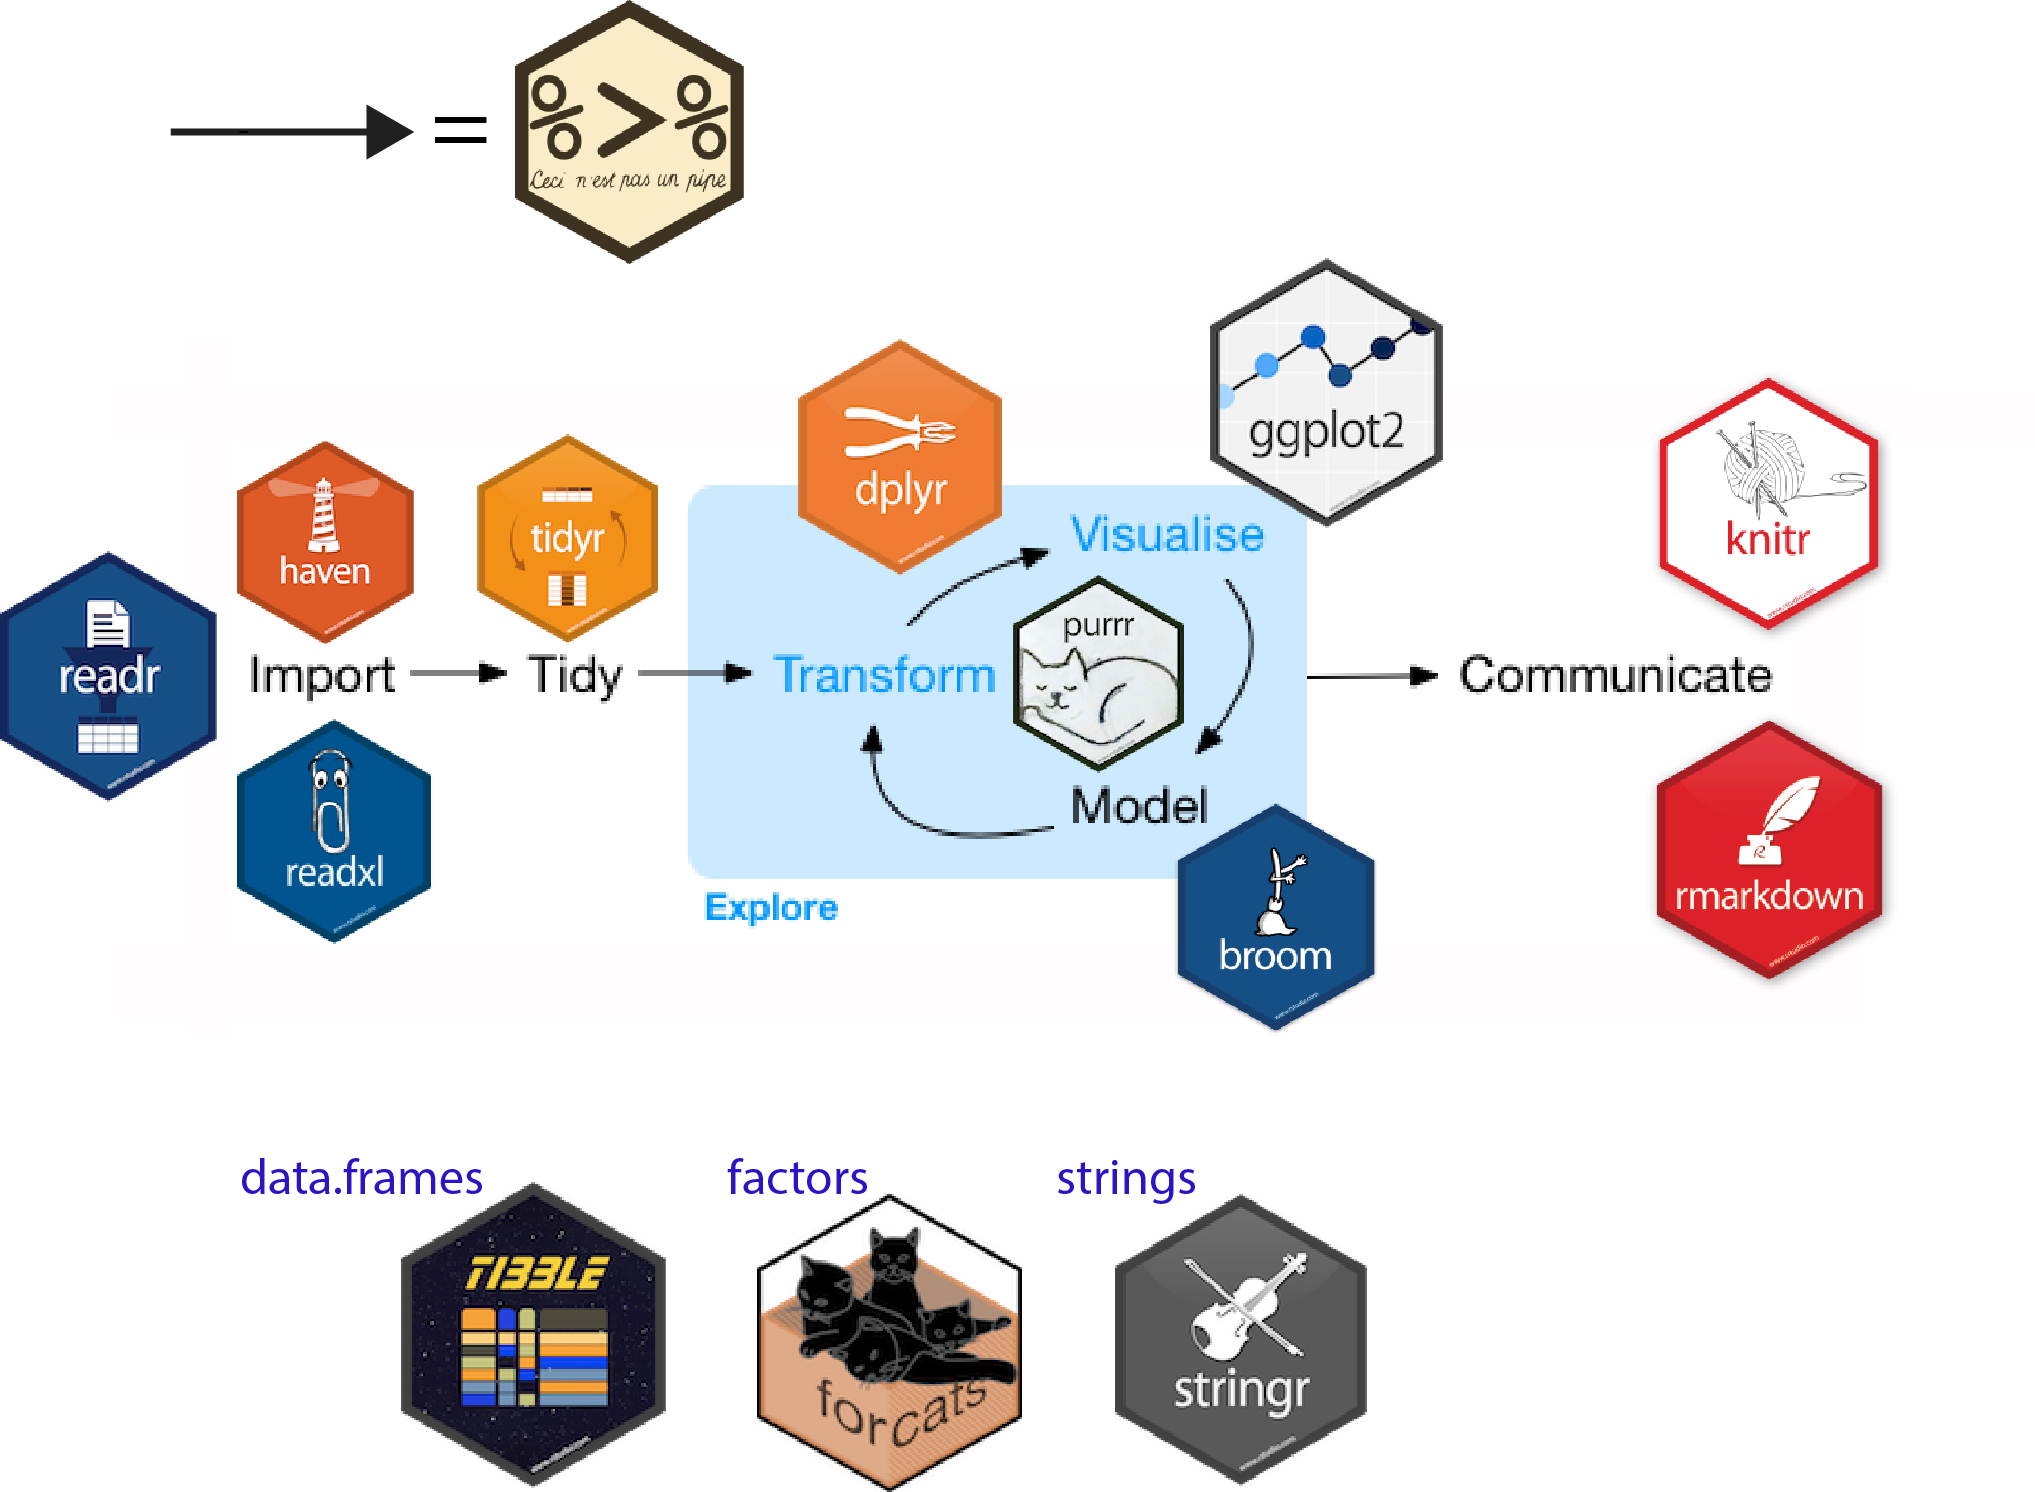
An introduction to the Tidyverse
https://bit.ly/3LWSBQK
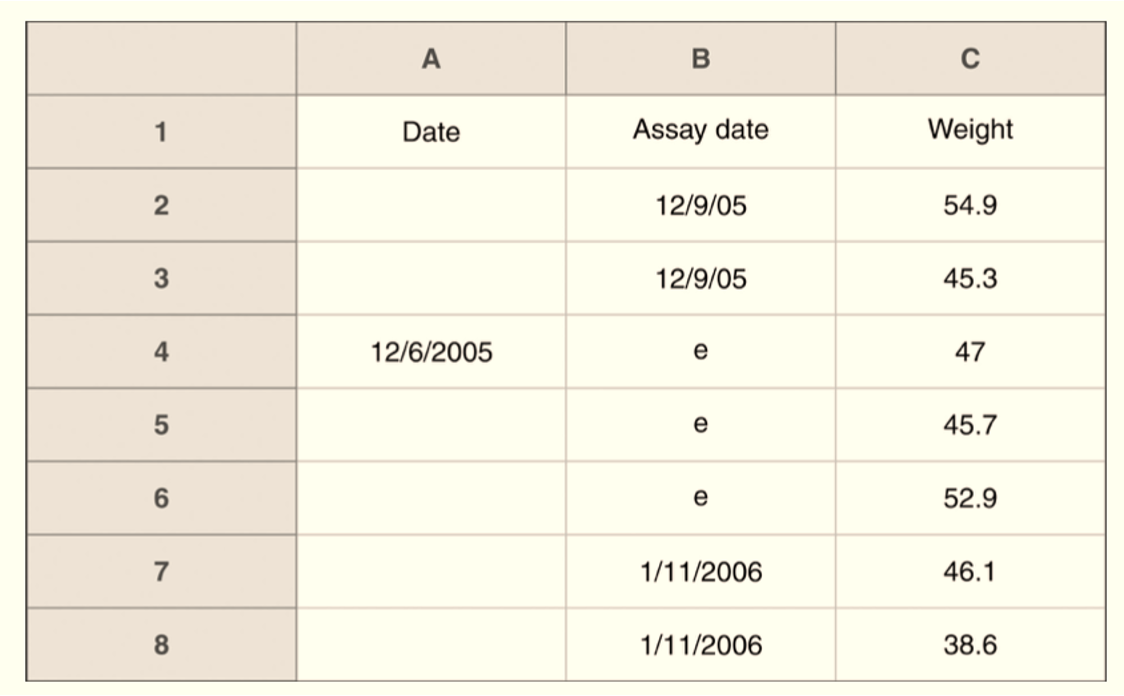
1. Empty cells
2. Inconsistency
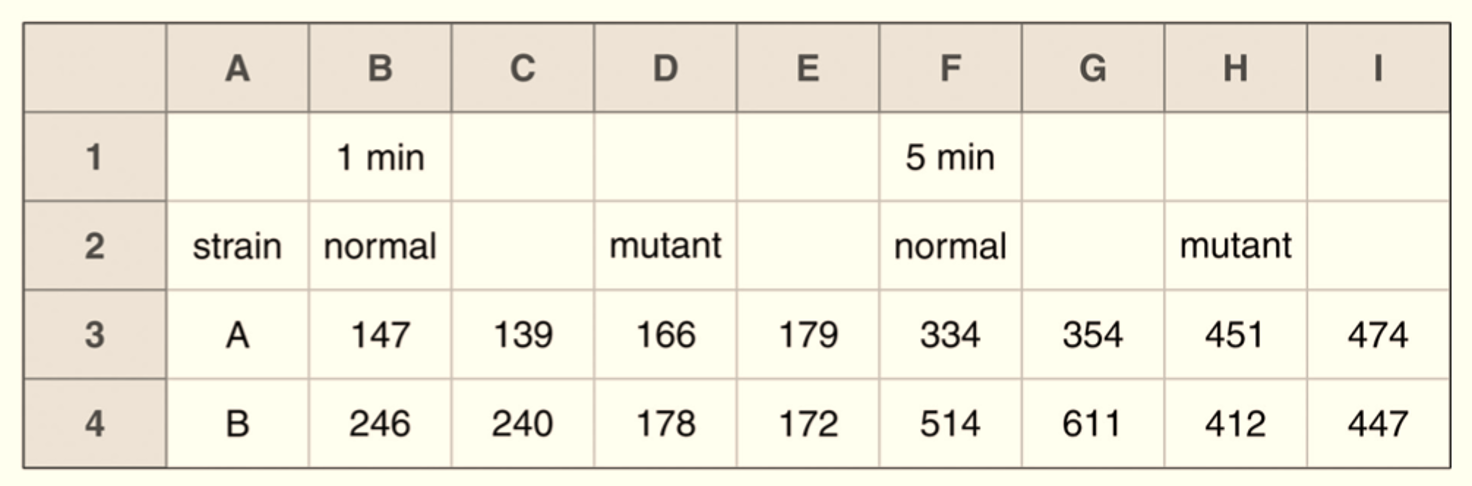
3. Complicated layout
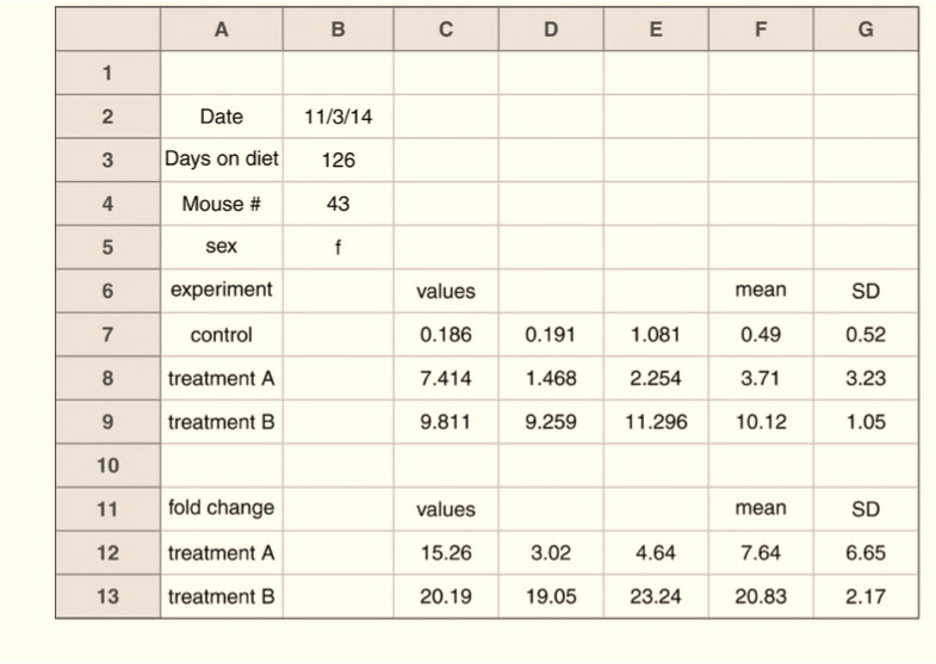
4. Multiple id-row

6. Summaries
7. True Horror data
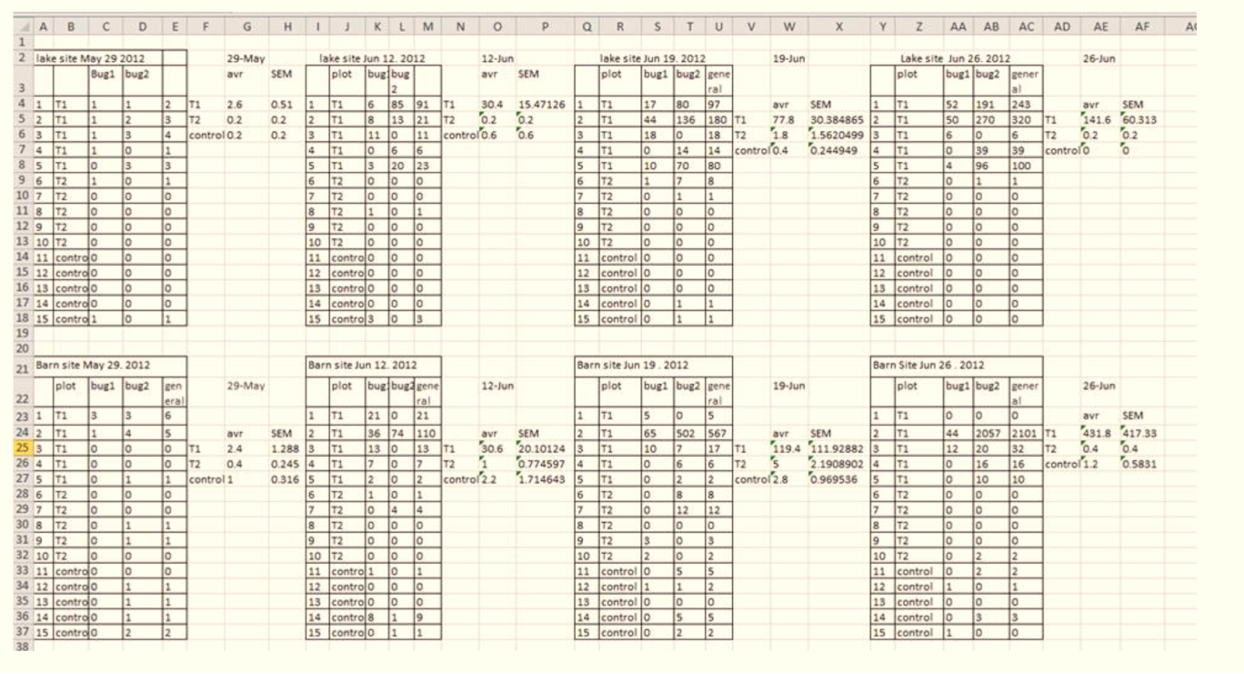
Horror data
A Tidy data set

Tidy data

Tidy data principles. Fuente: https://r4ds.had.co.nz/tidy-data.html
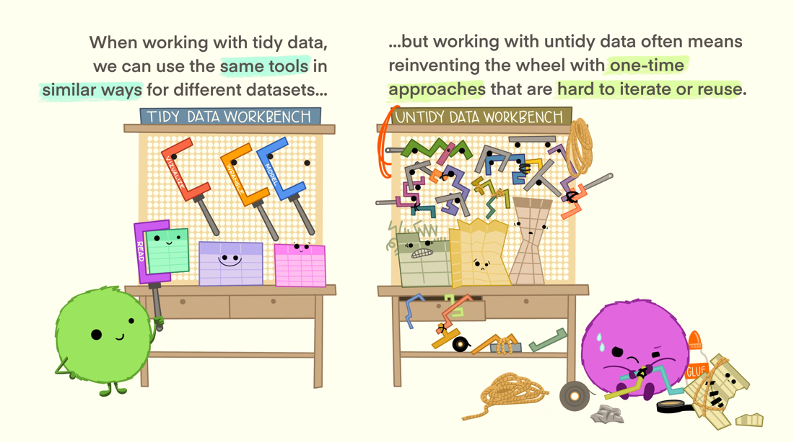
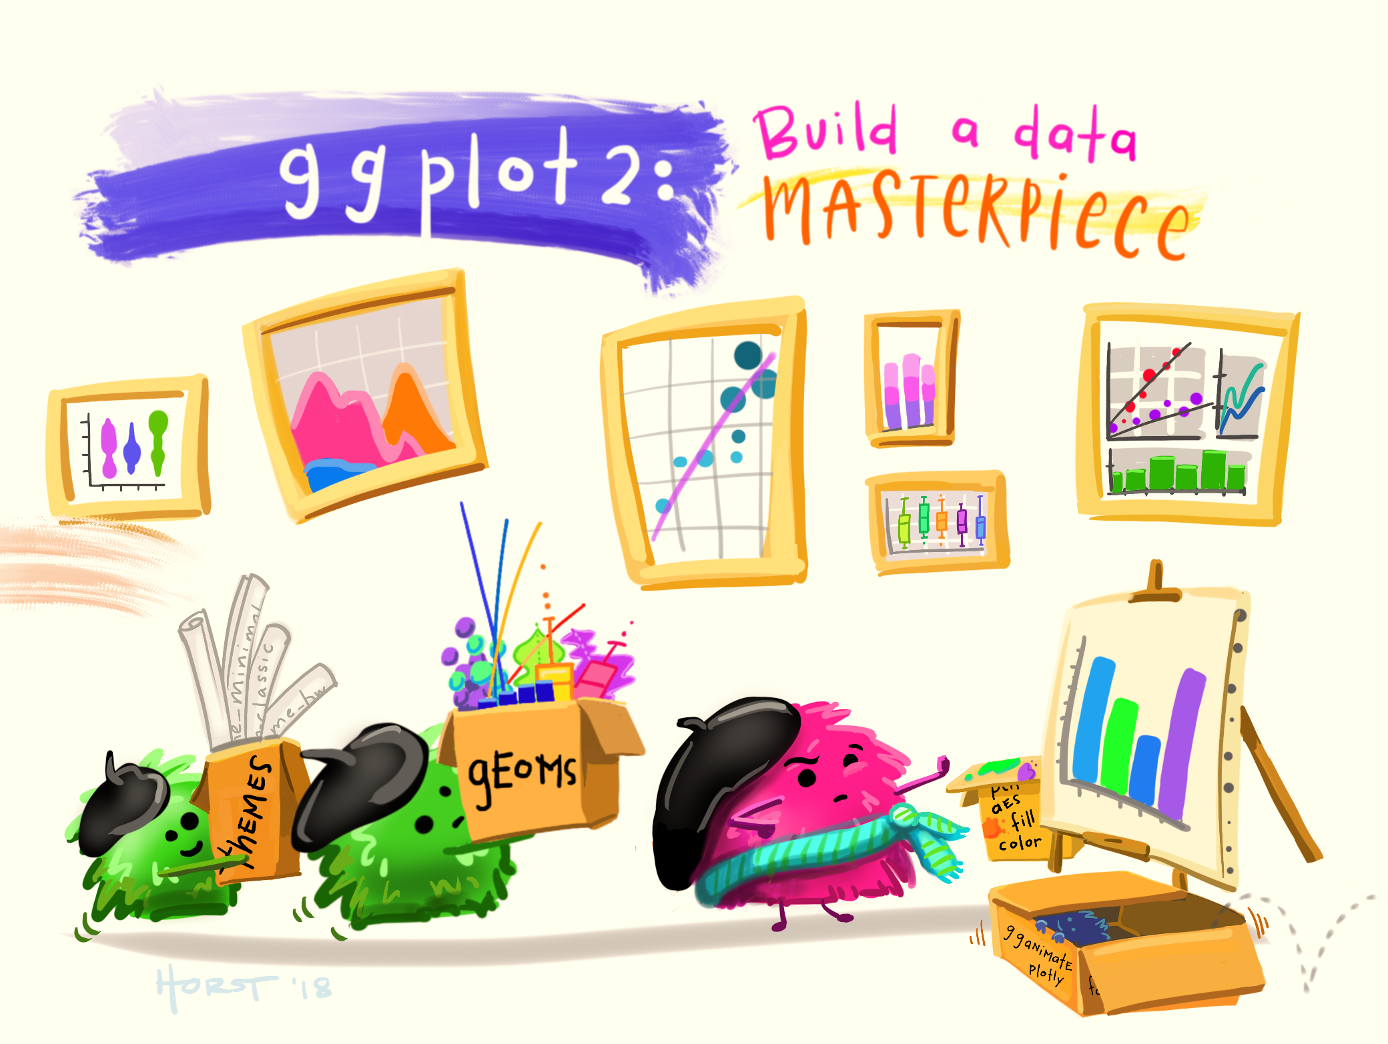
Make friends with tidy data


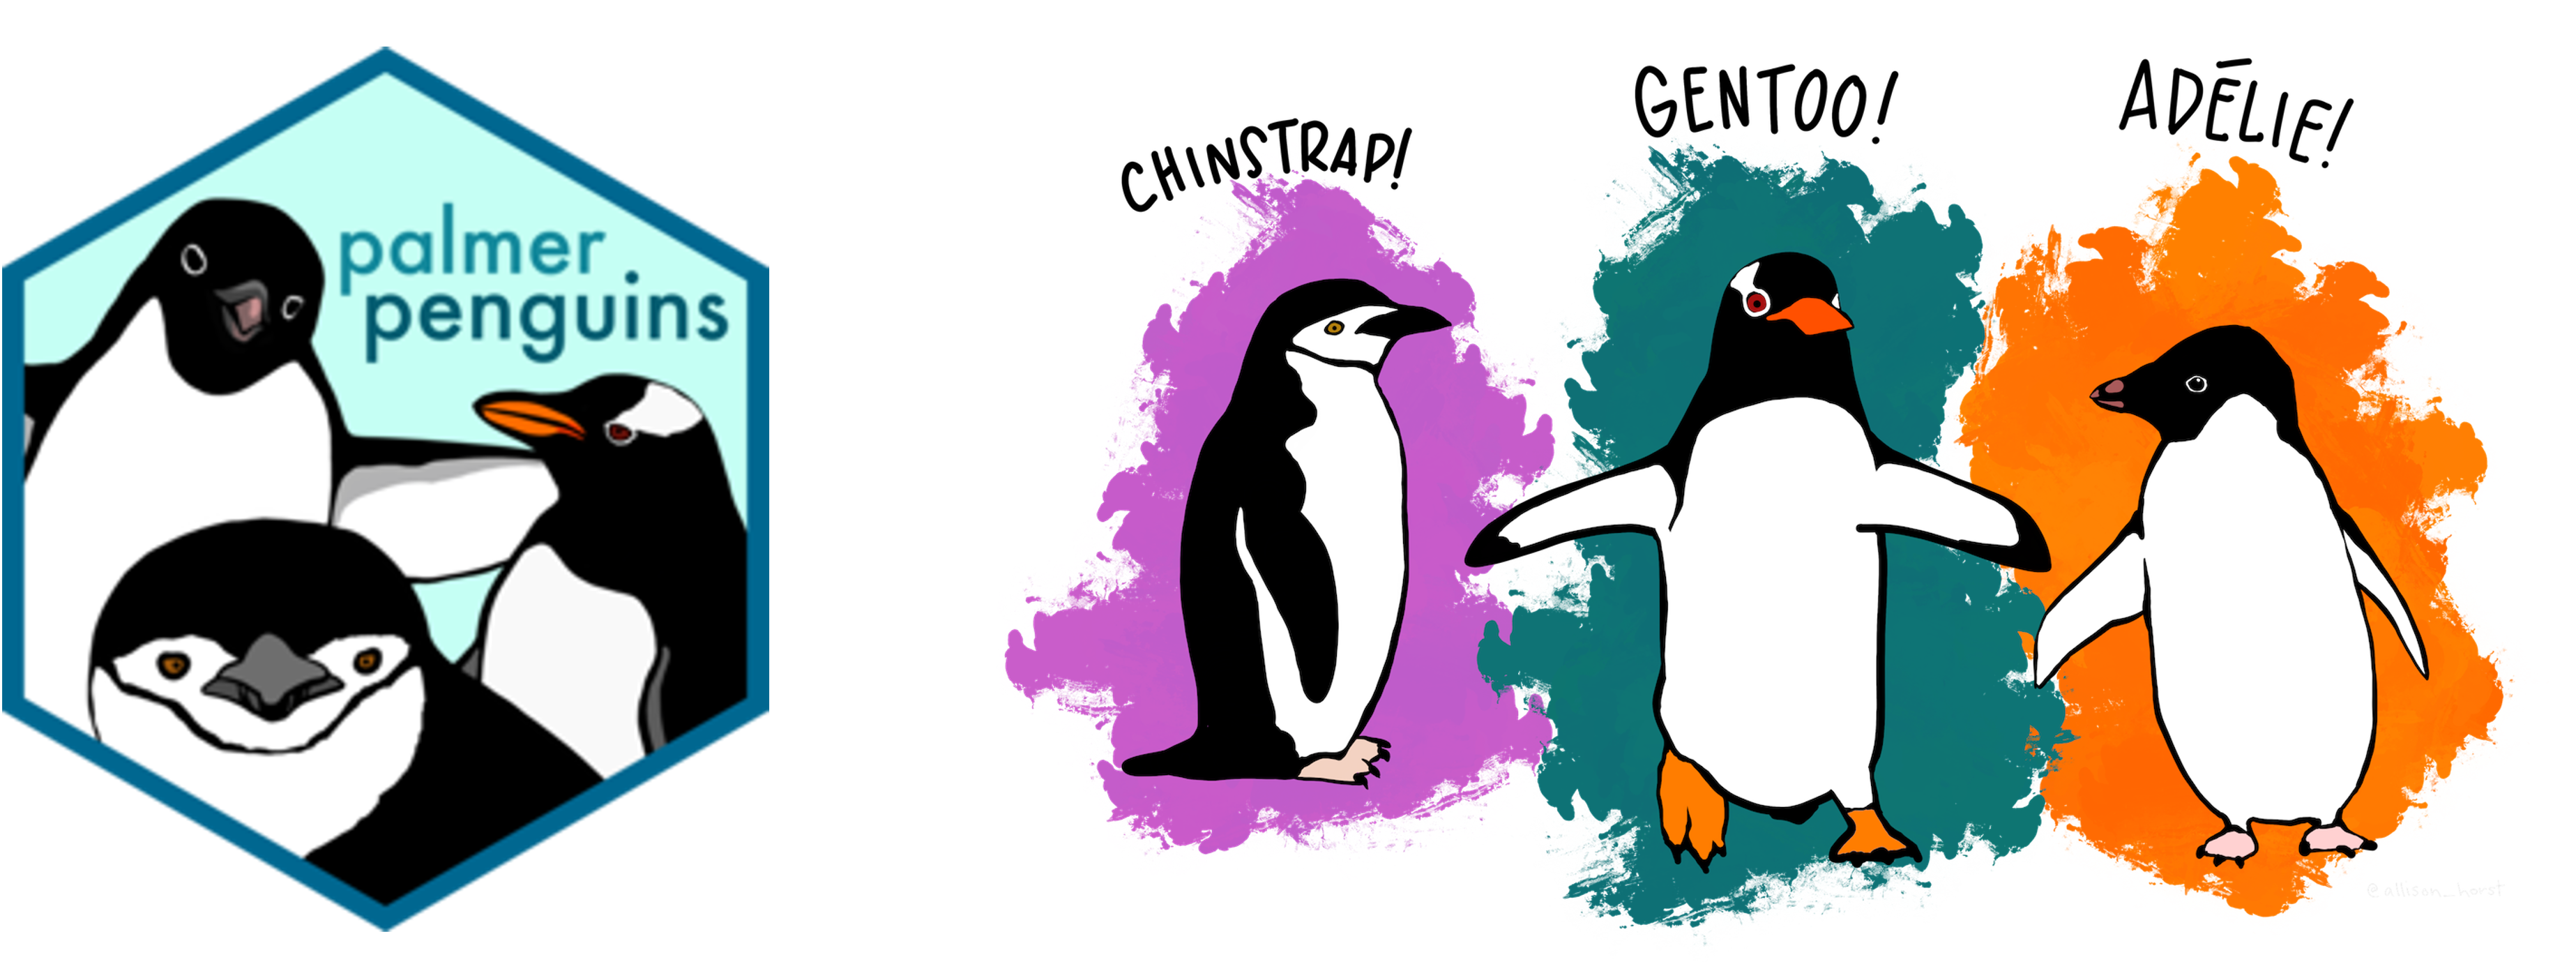
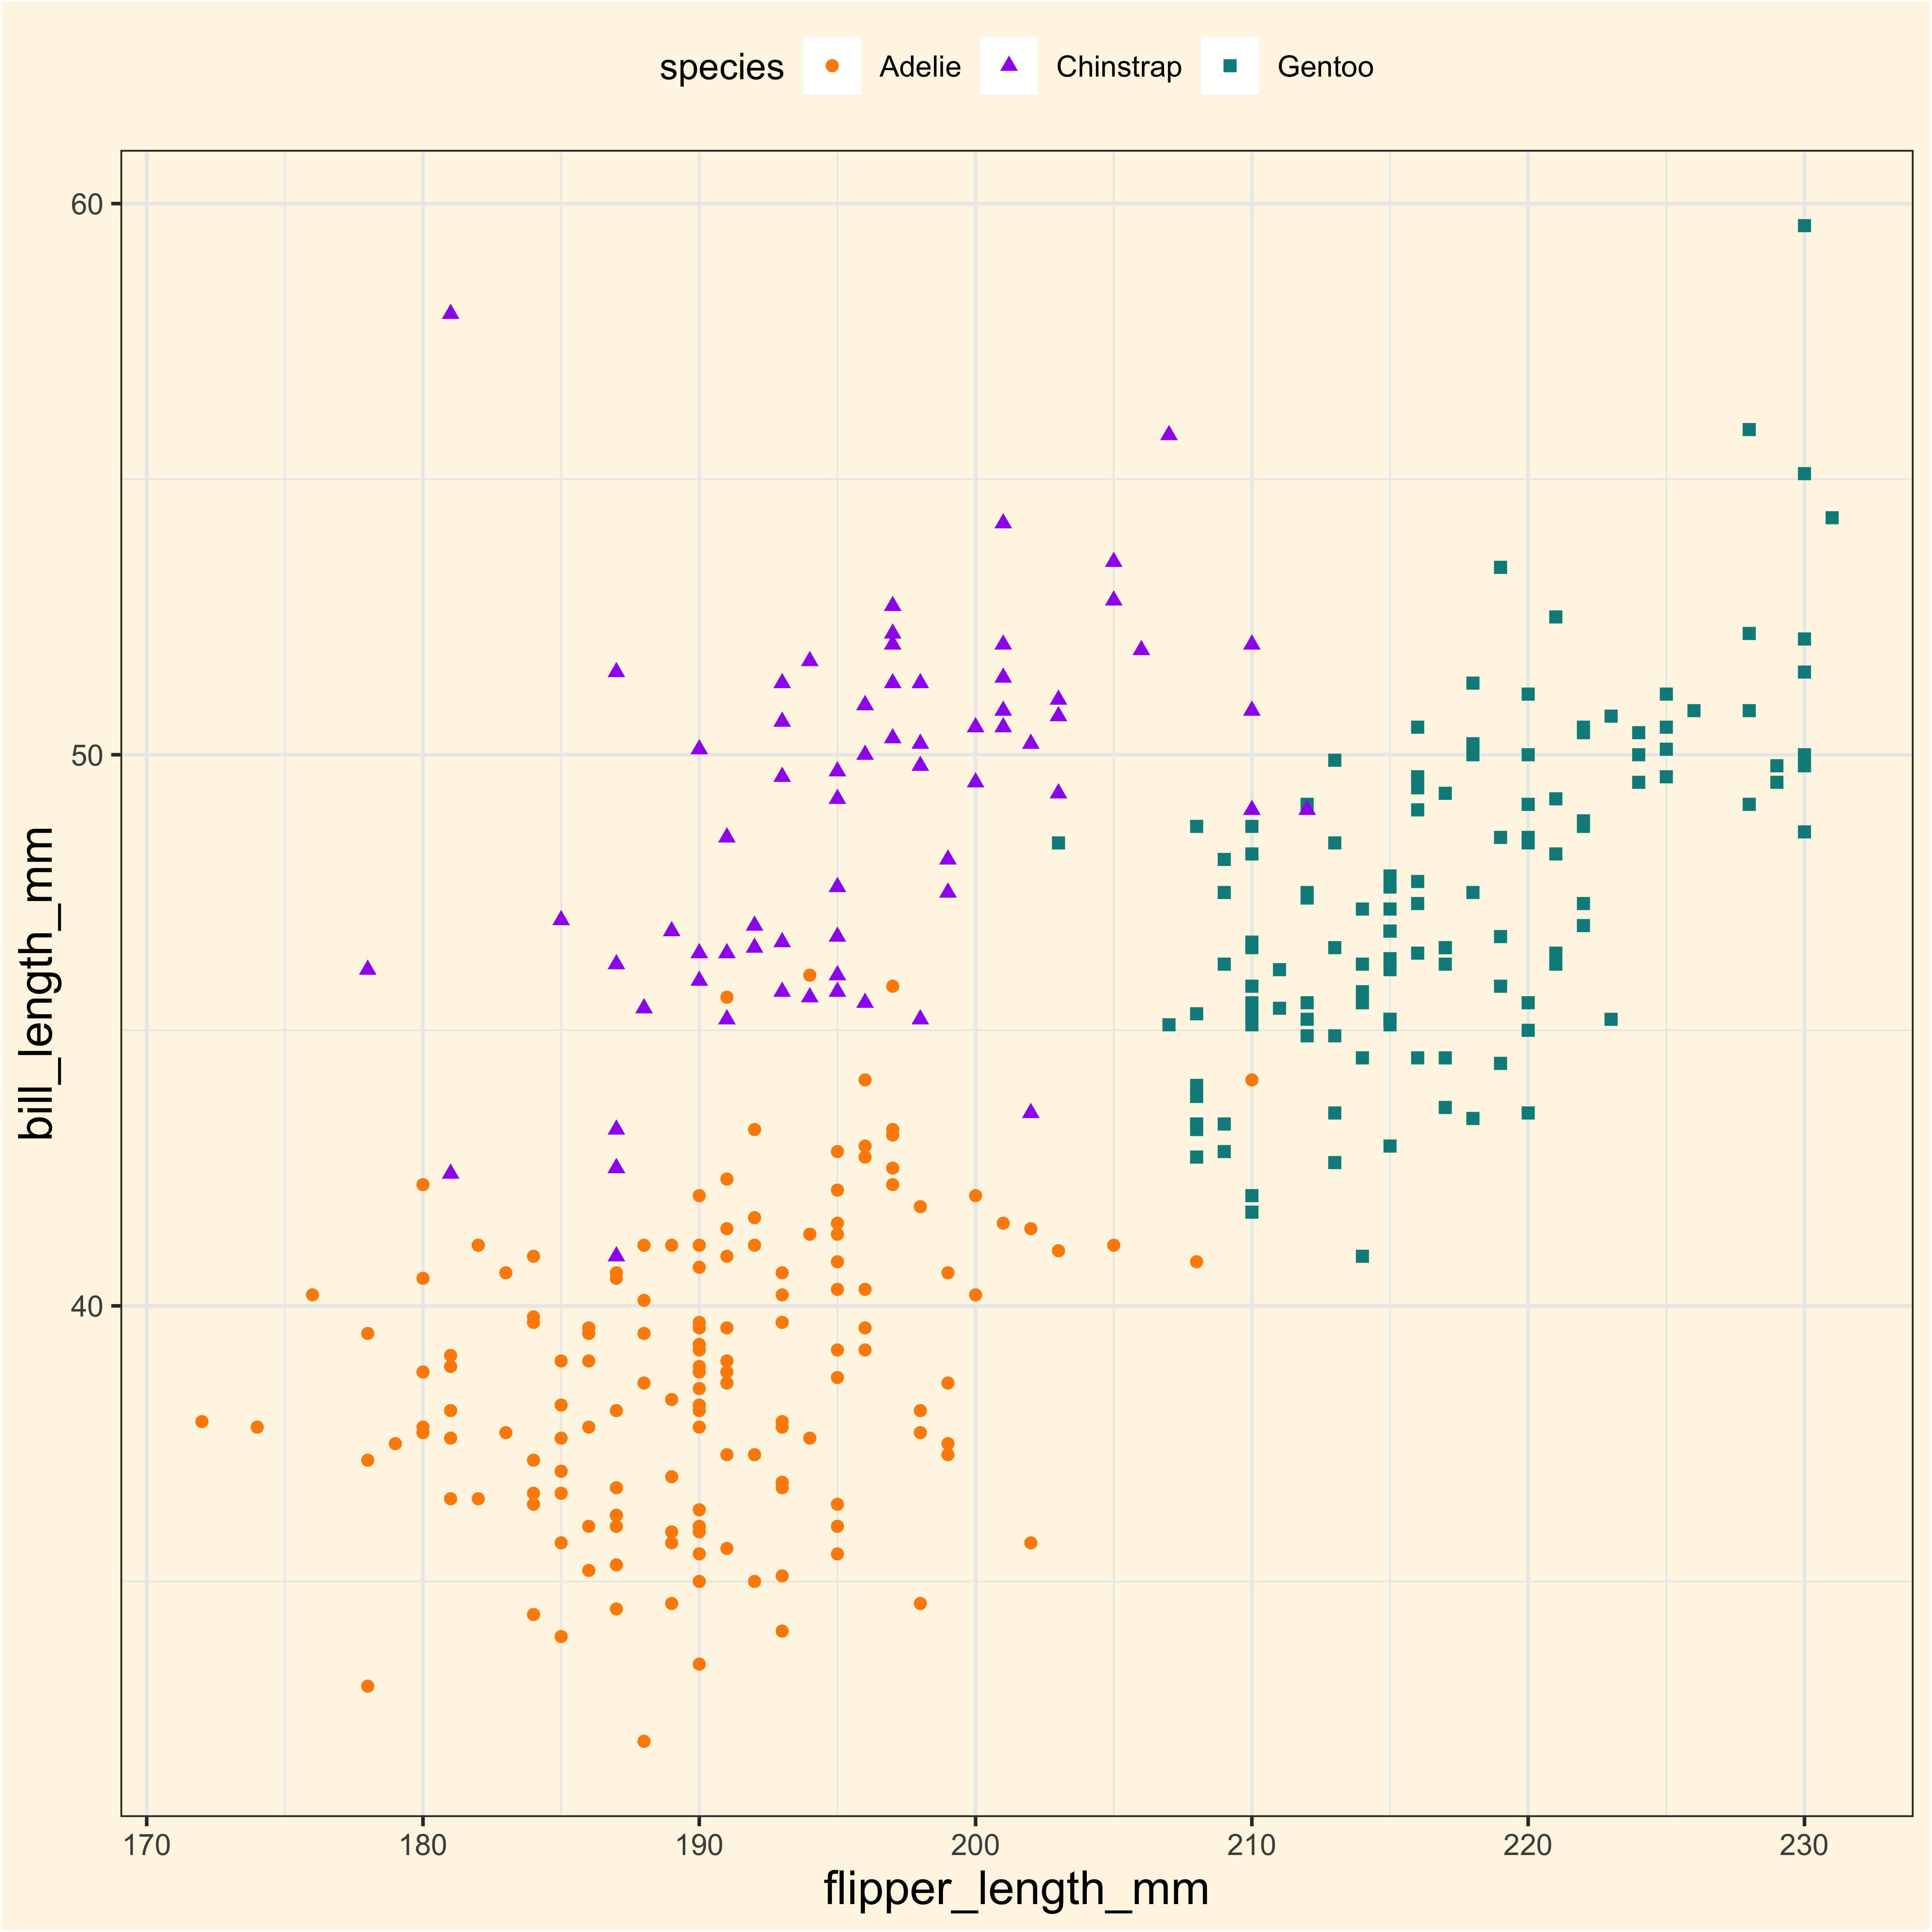
The Palmer Penguins Data Set
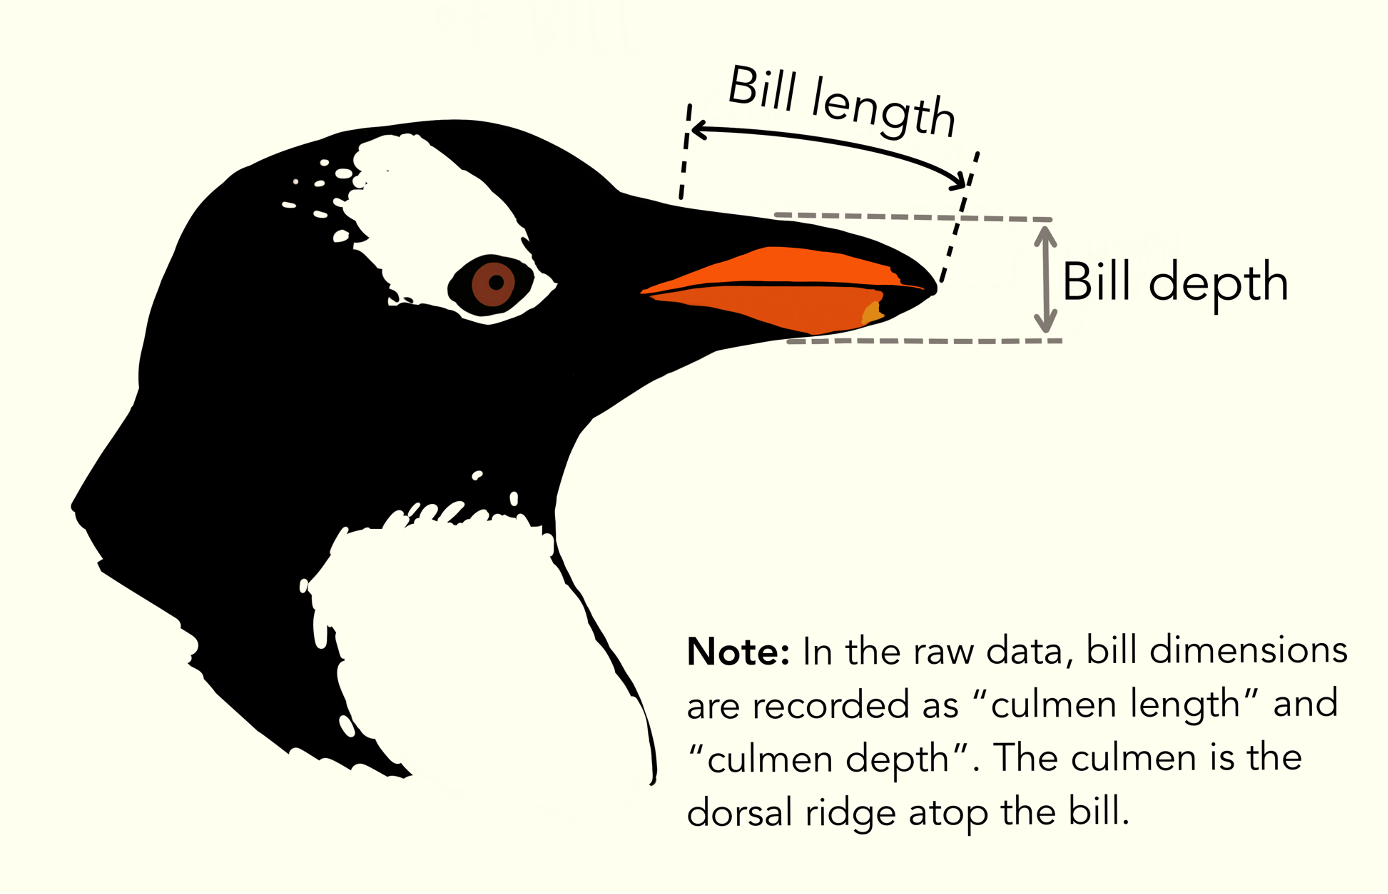
Data wrangling and cleaning

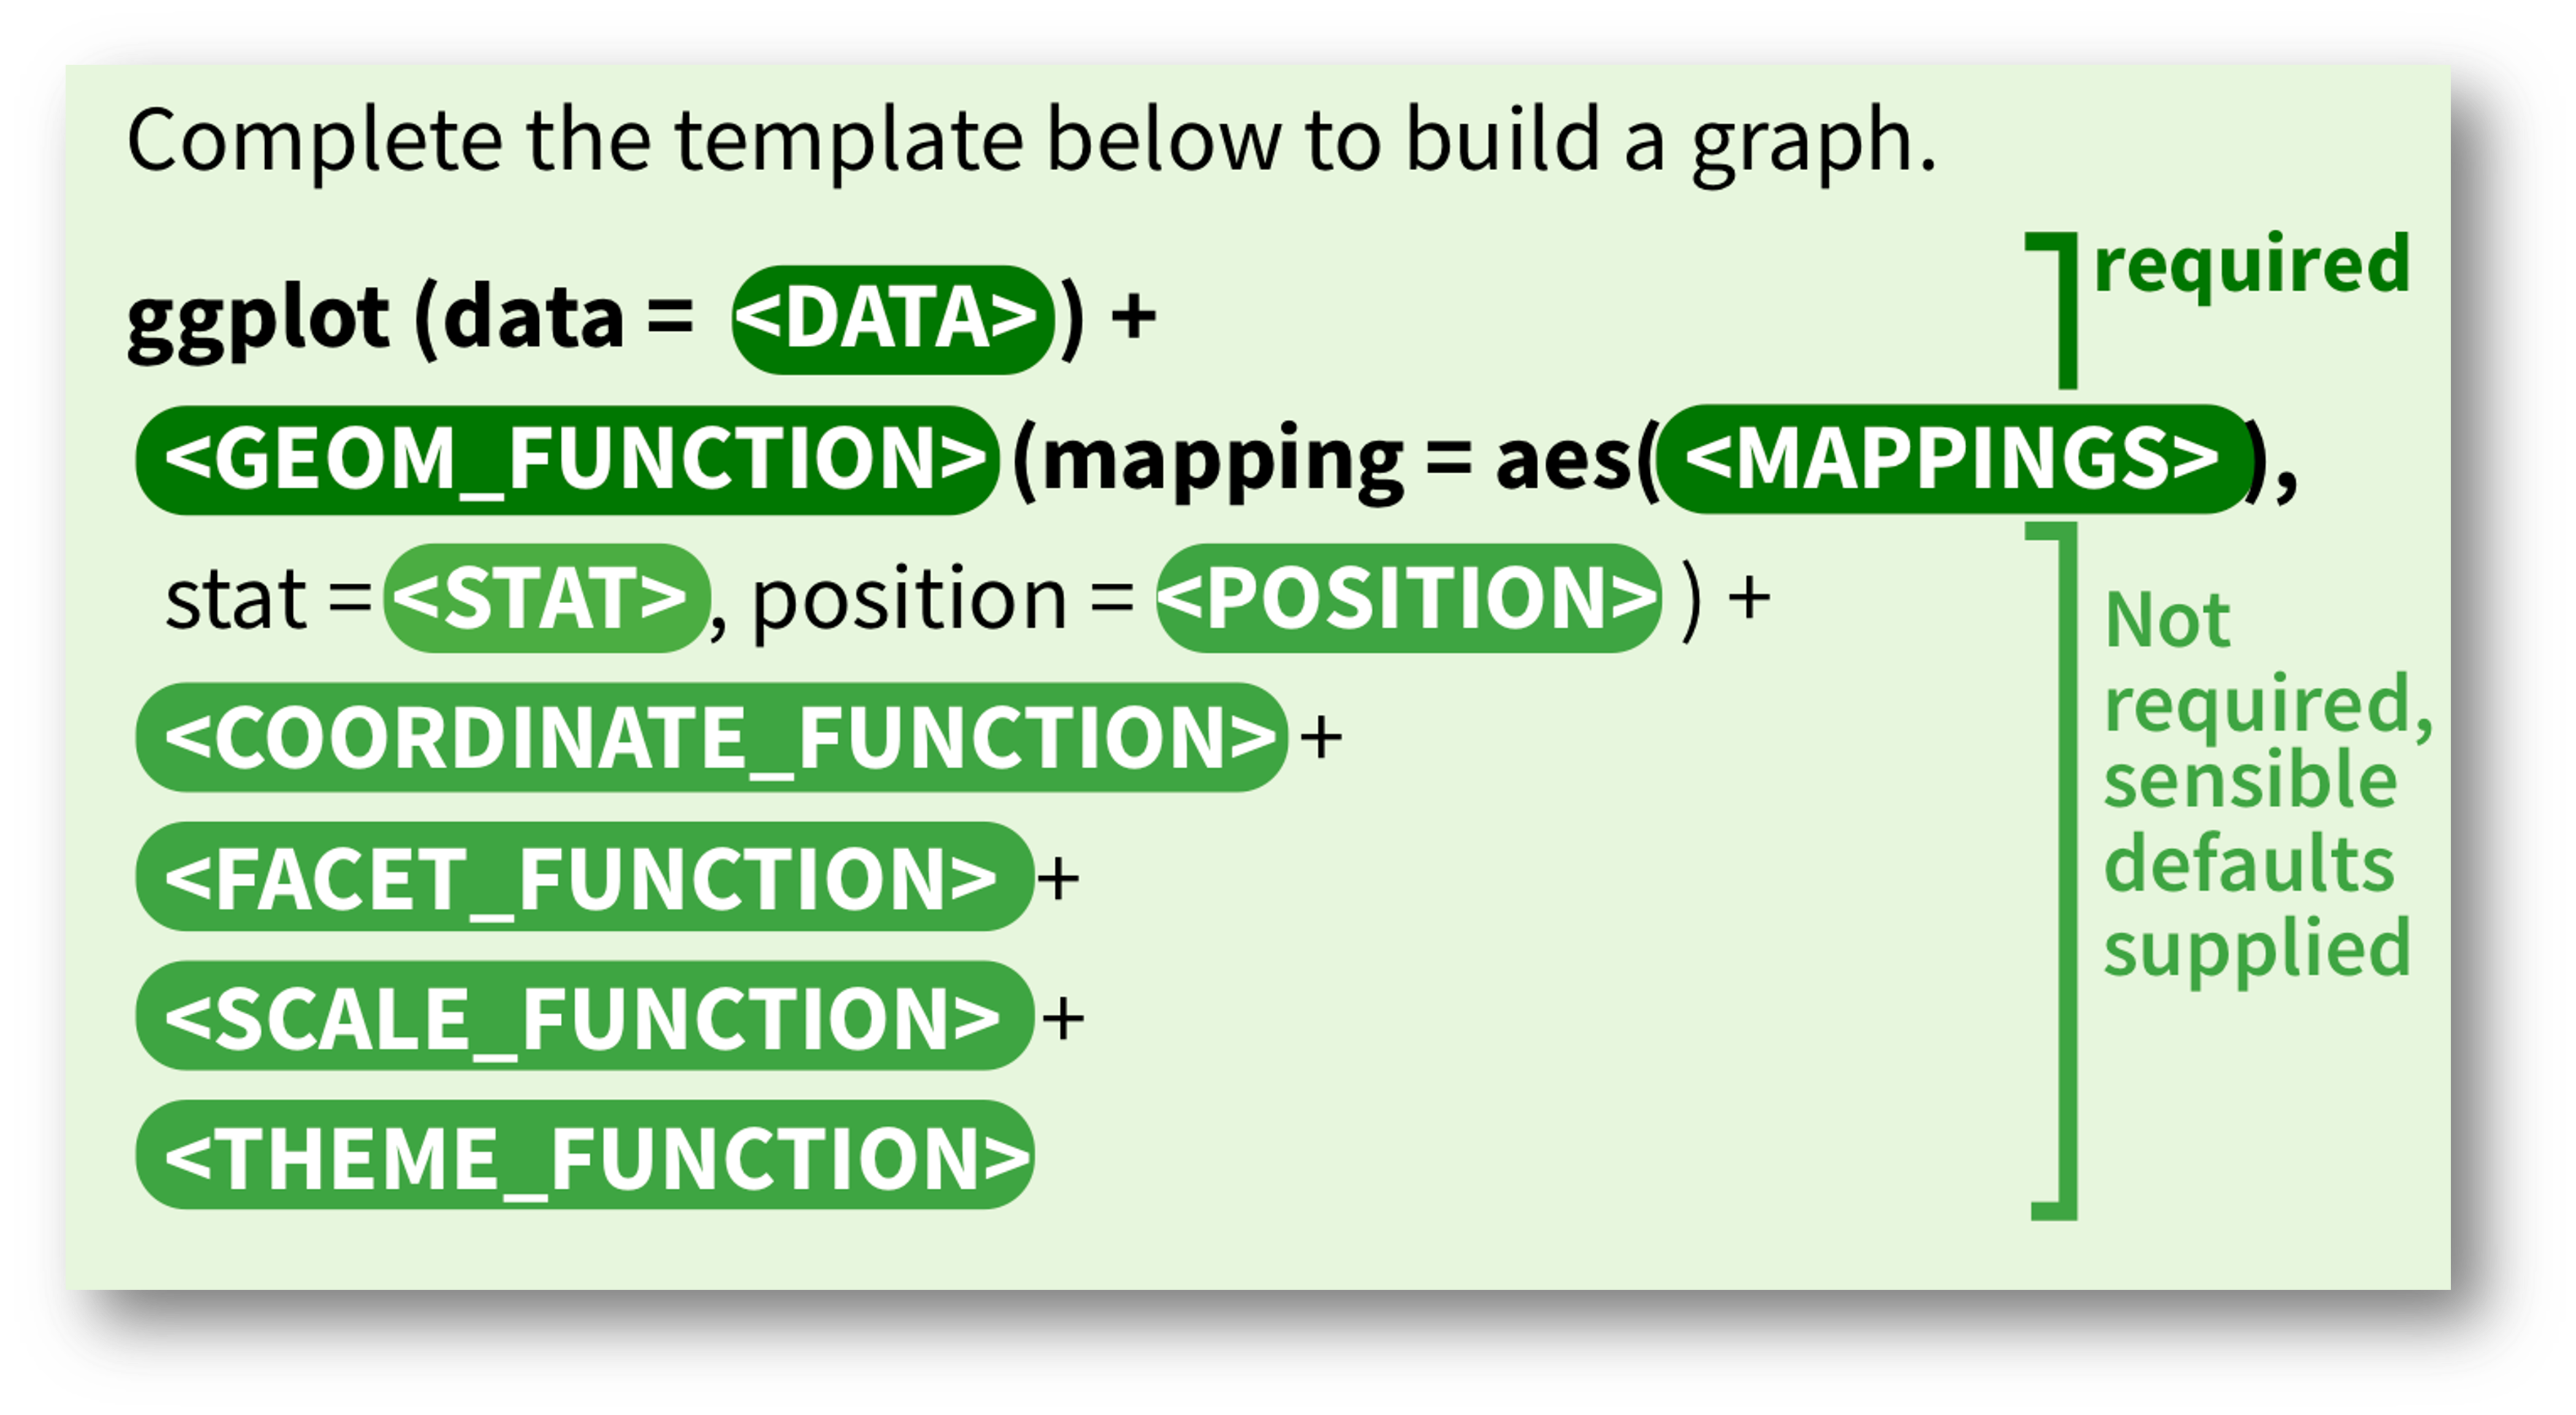
Code
ggplot(
data = penguins,
aes(
x = flipper_length_mm,
y = bill_length_mm
)
) +
geom_point(
aes(
color = species,
shape = species
),
size = 3,
alpha = 0.8
) +
scale_color_manual(values = c("darkorange", "purple", "cyan4")) +
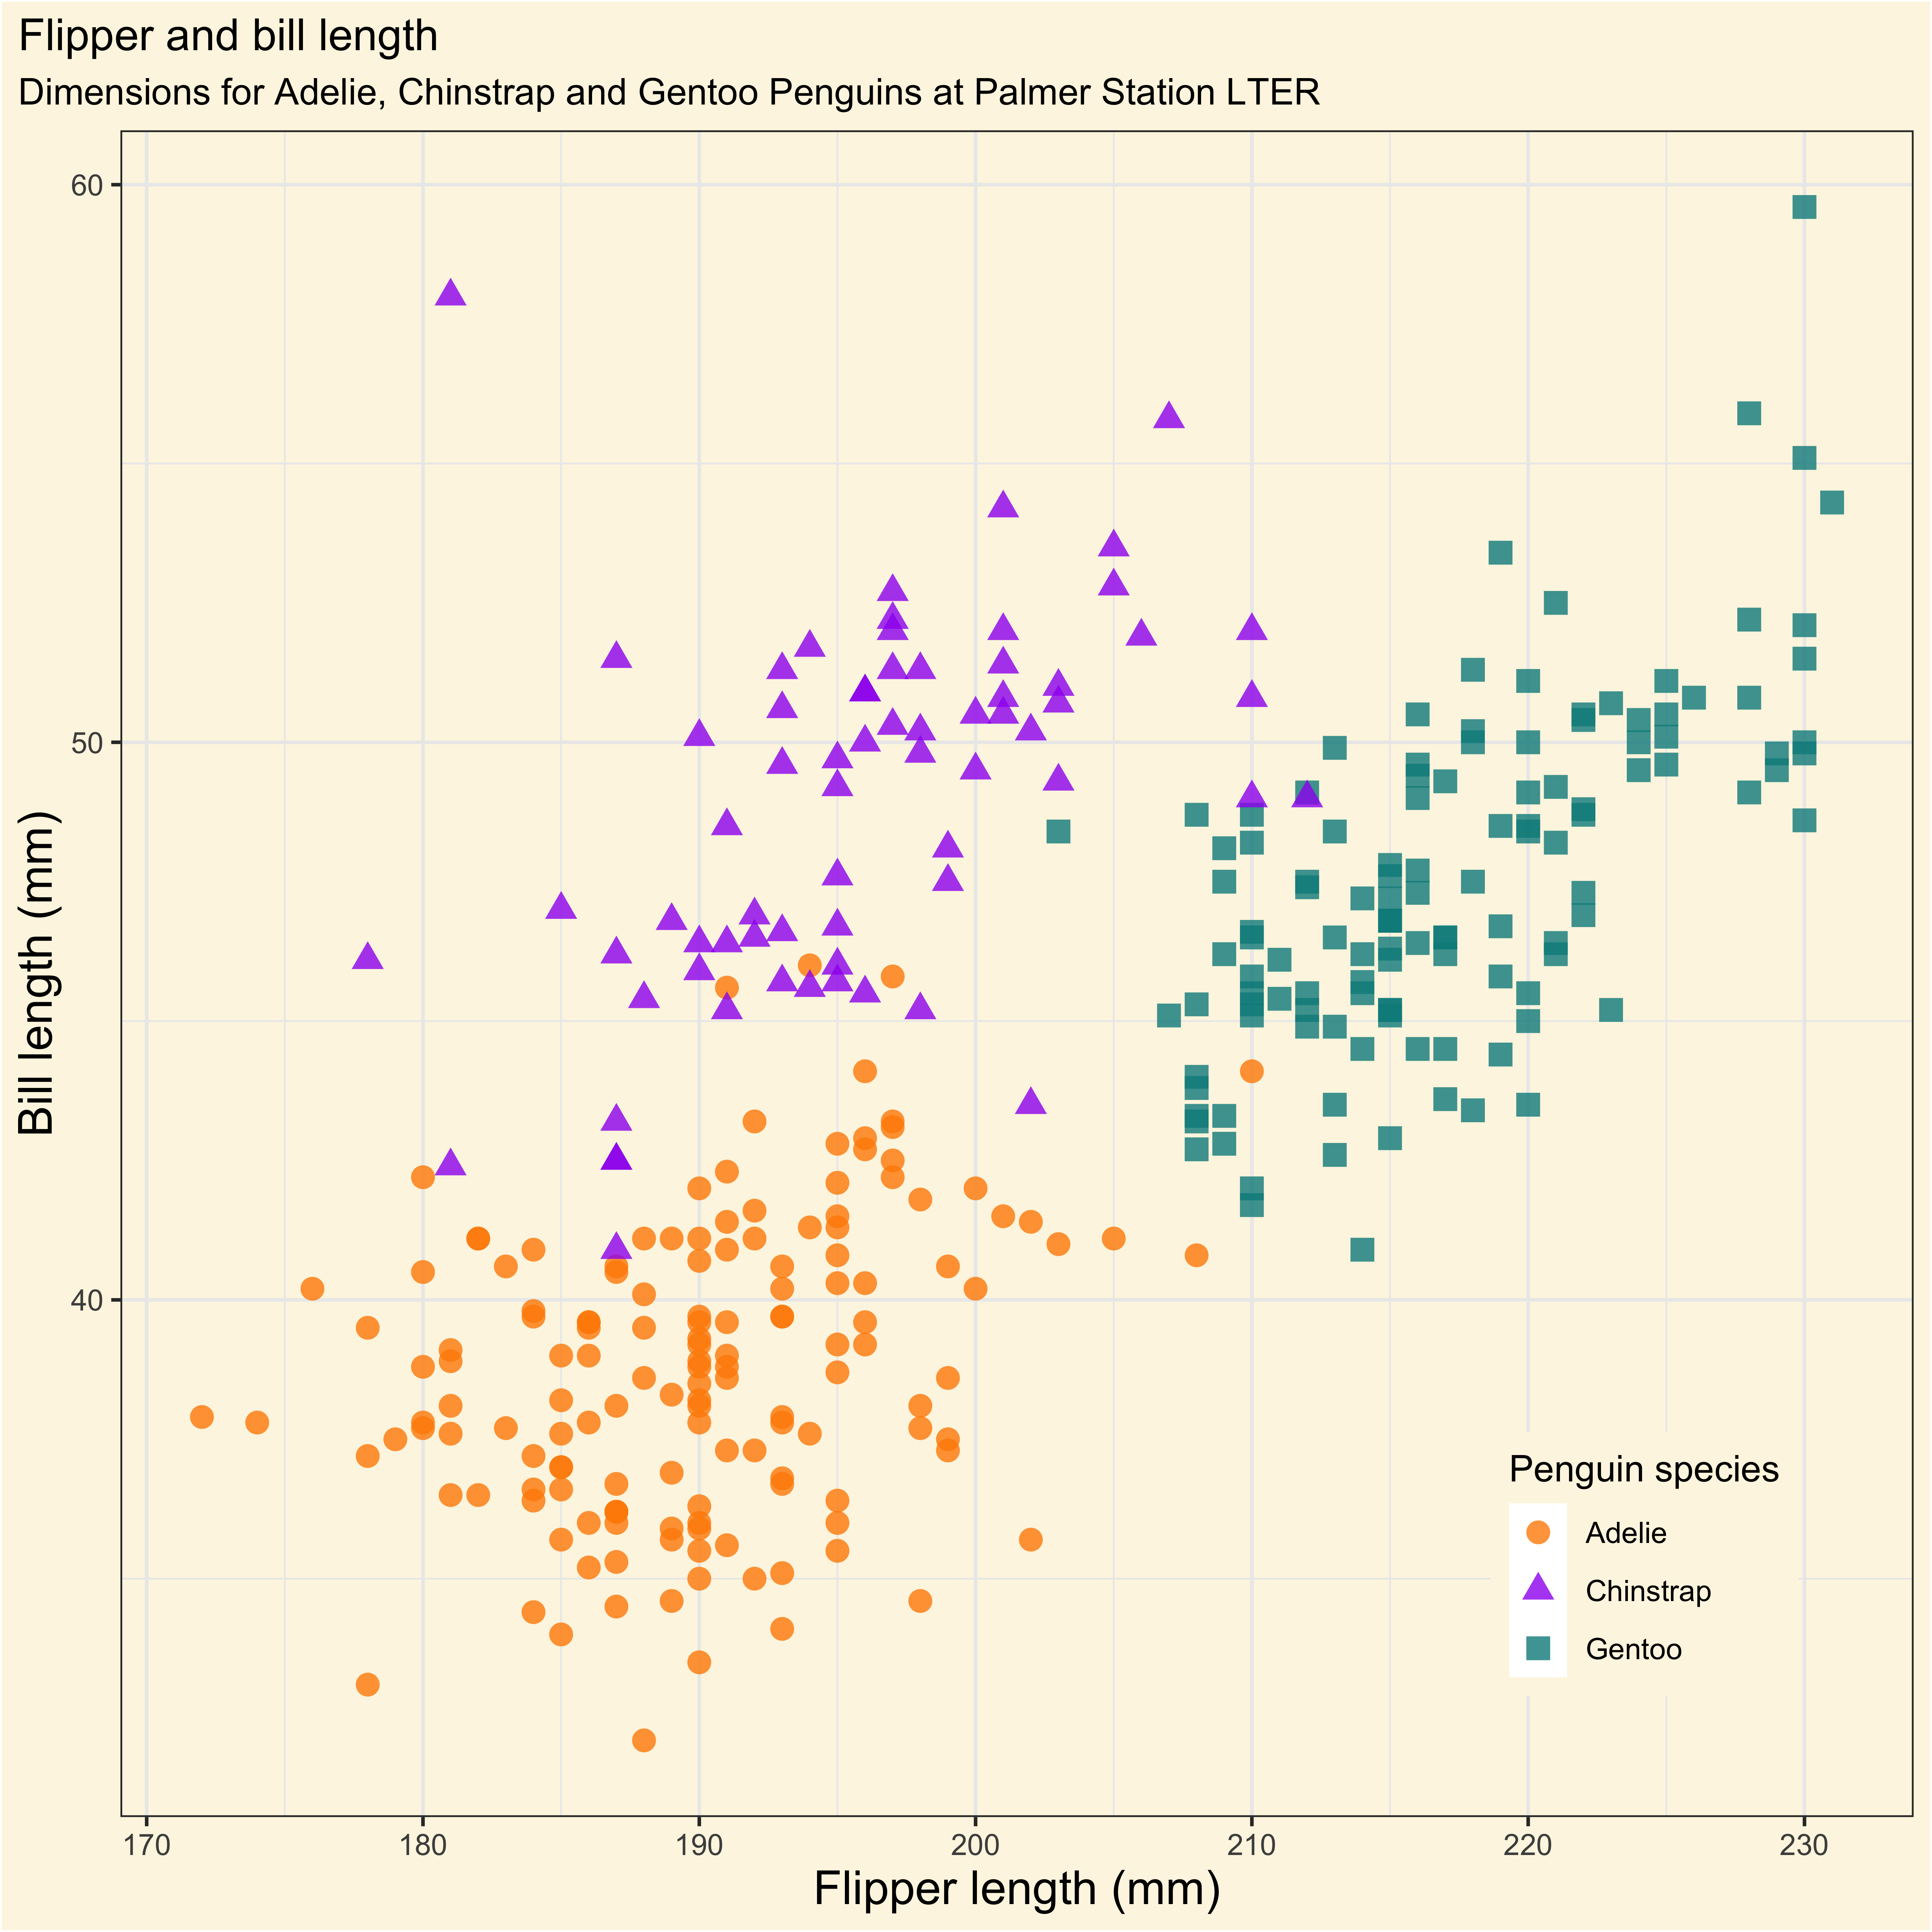
labs(
title = "Flipper and bill length",
subtitle = "Dimensions for Adelie, Chinstrap and Gentoo Penguins at Palmer Station LTER",
x = "Flipper length (mm)",
y = "Bill length (mm)",
color = "Penguin species",
shape = "Penguin species"
) +
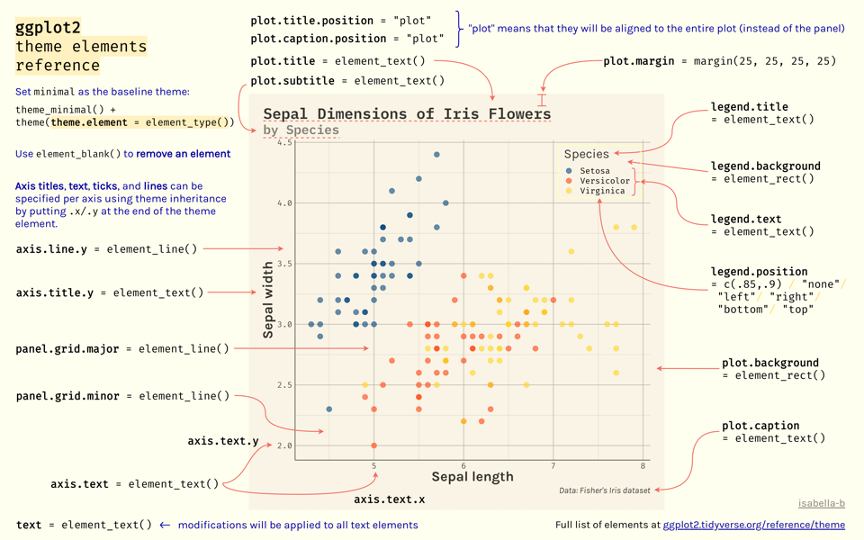
theme(
legend.position = c(0.85, 0.15),
plot.title.position = "plot",
plot.caption = element_text(hjust = 0, face = "italic"),
plot.caption.position = "plot"
)
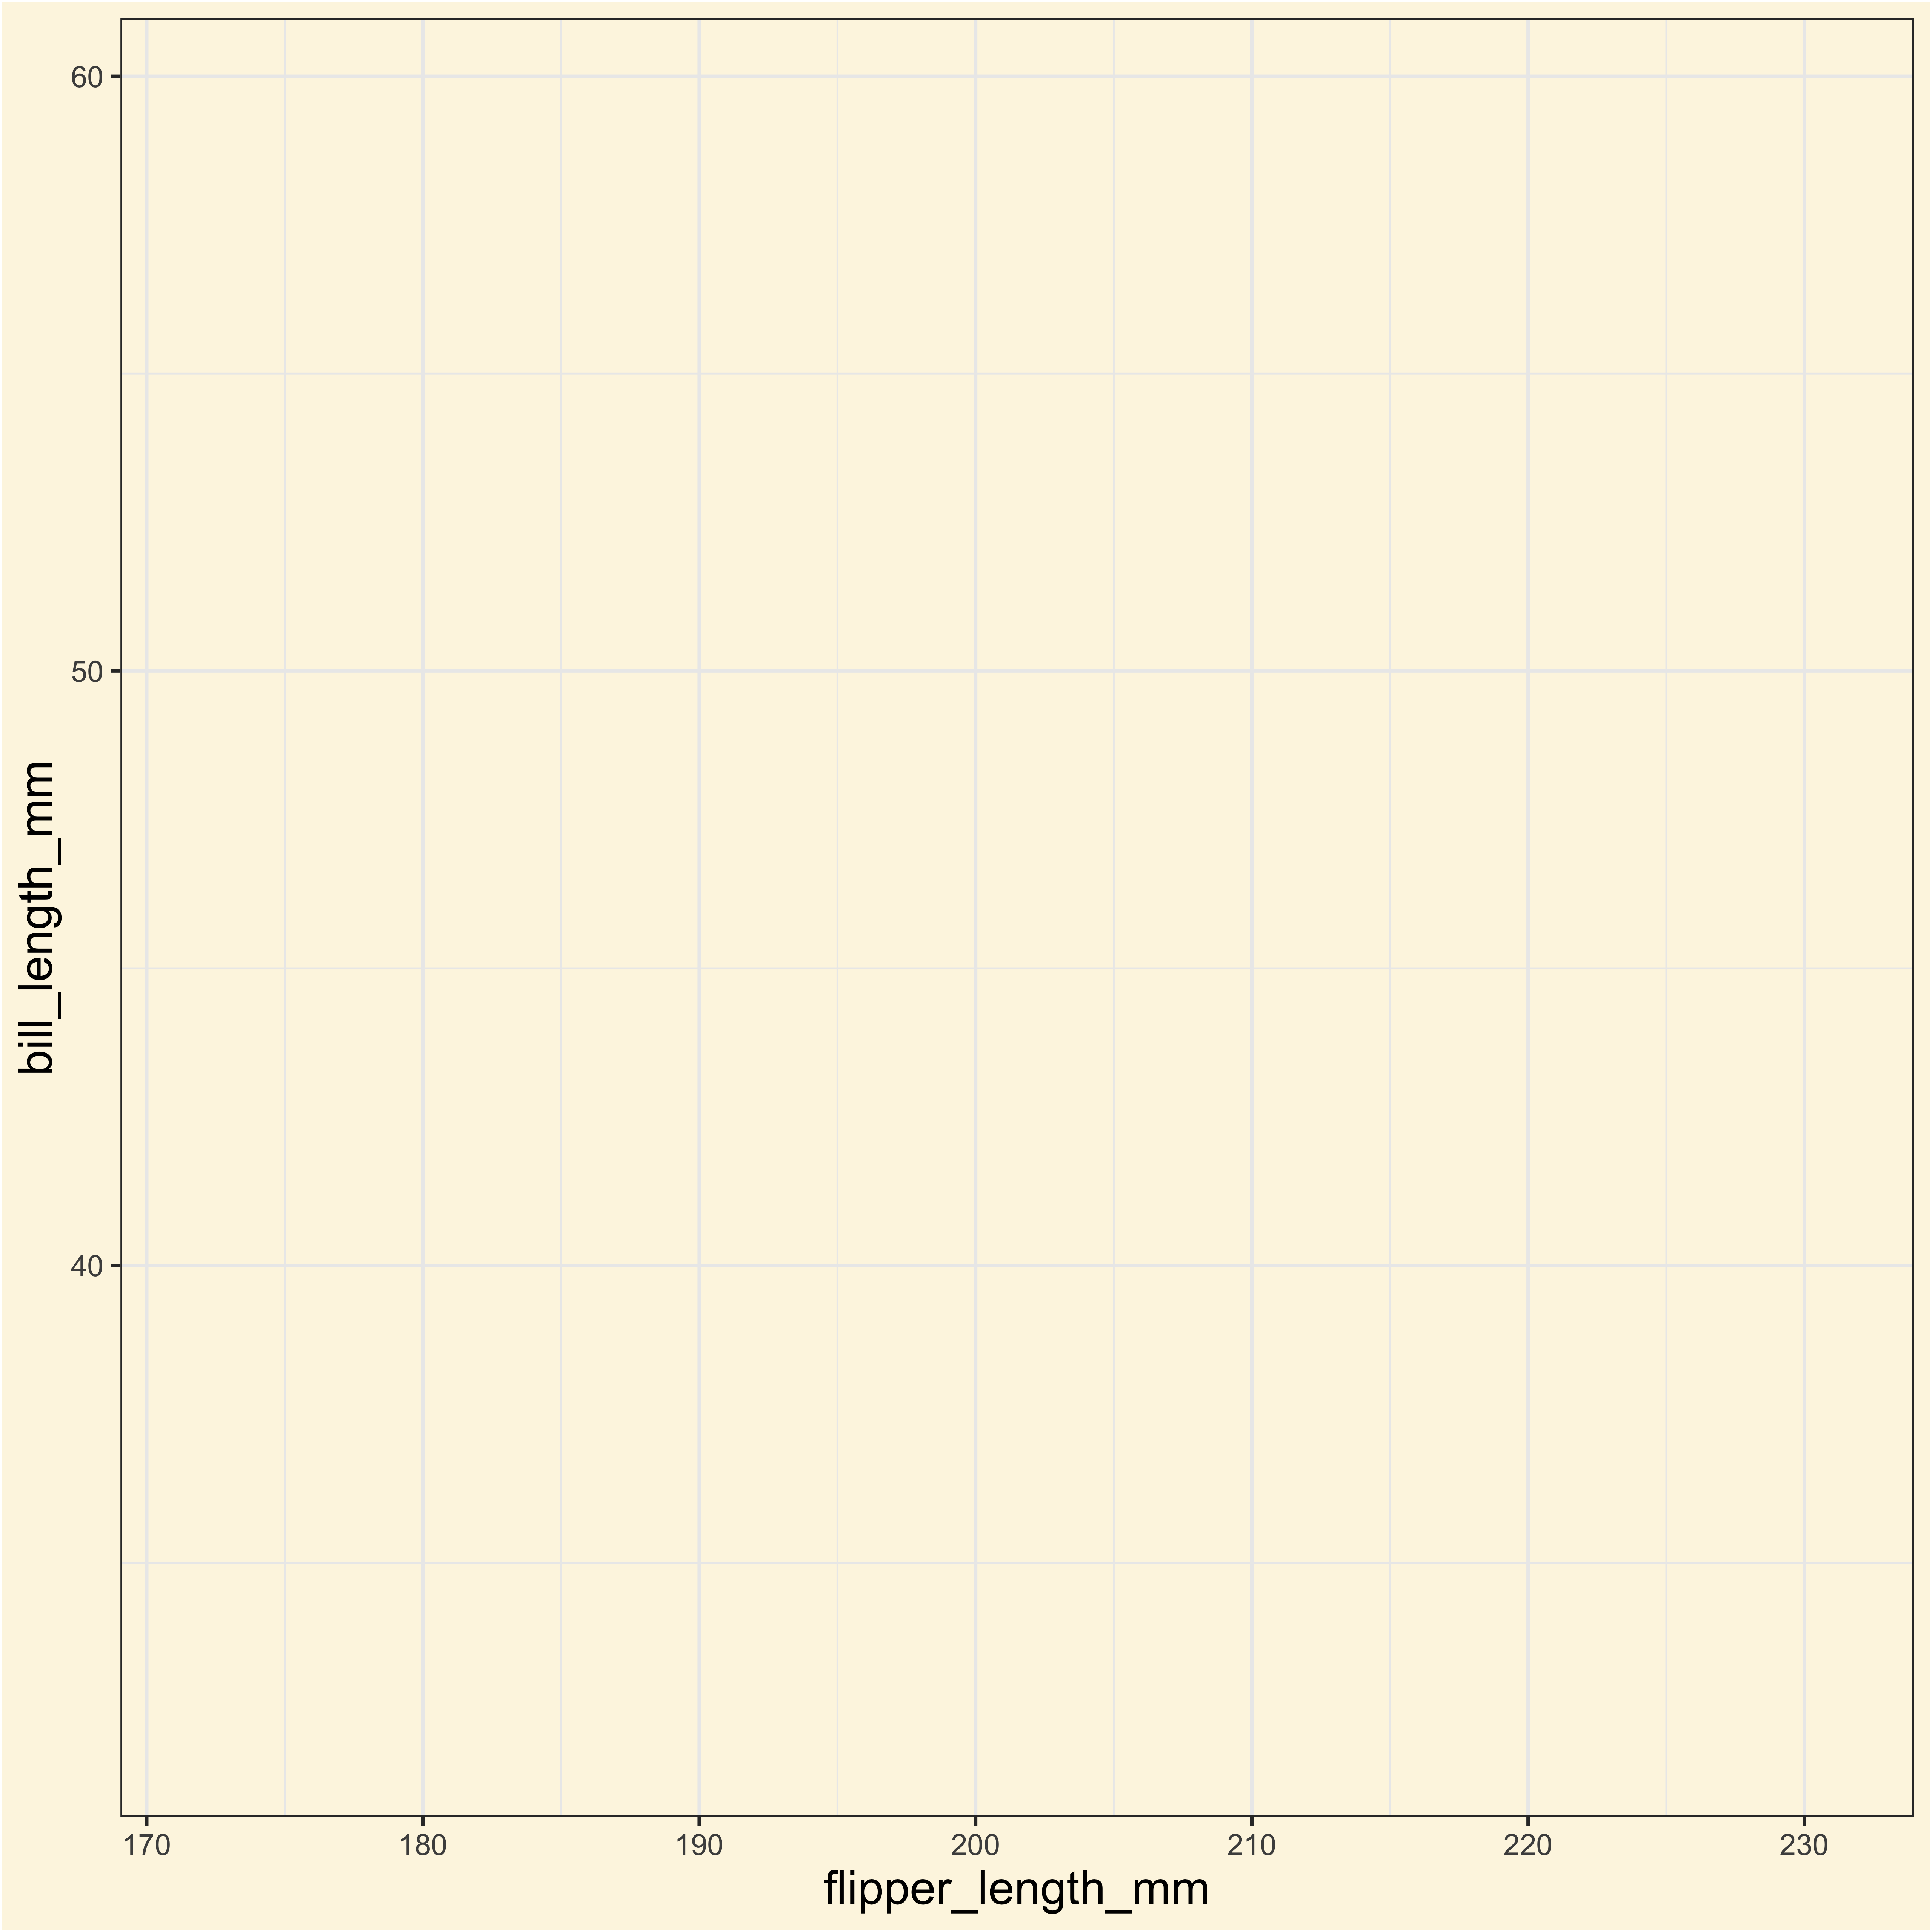
ggplot(
  data = penguins,
  aes(
    x = flipper_length_mm,
    y = bill_length_mm
  )
) +
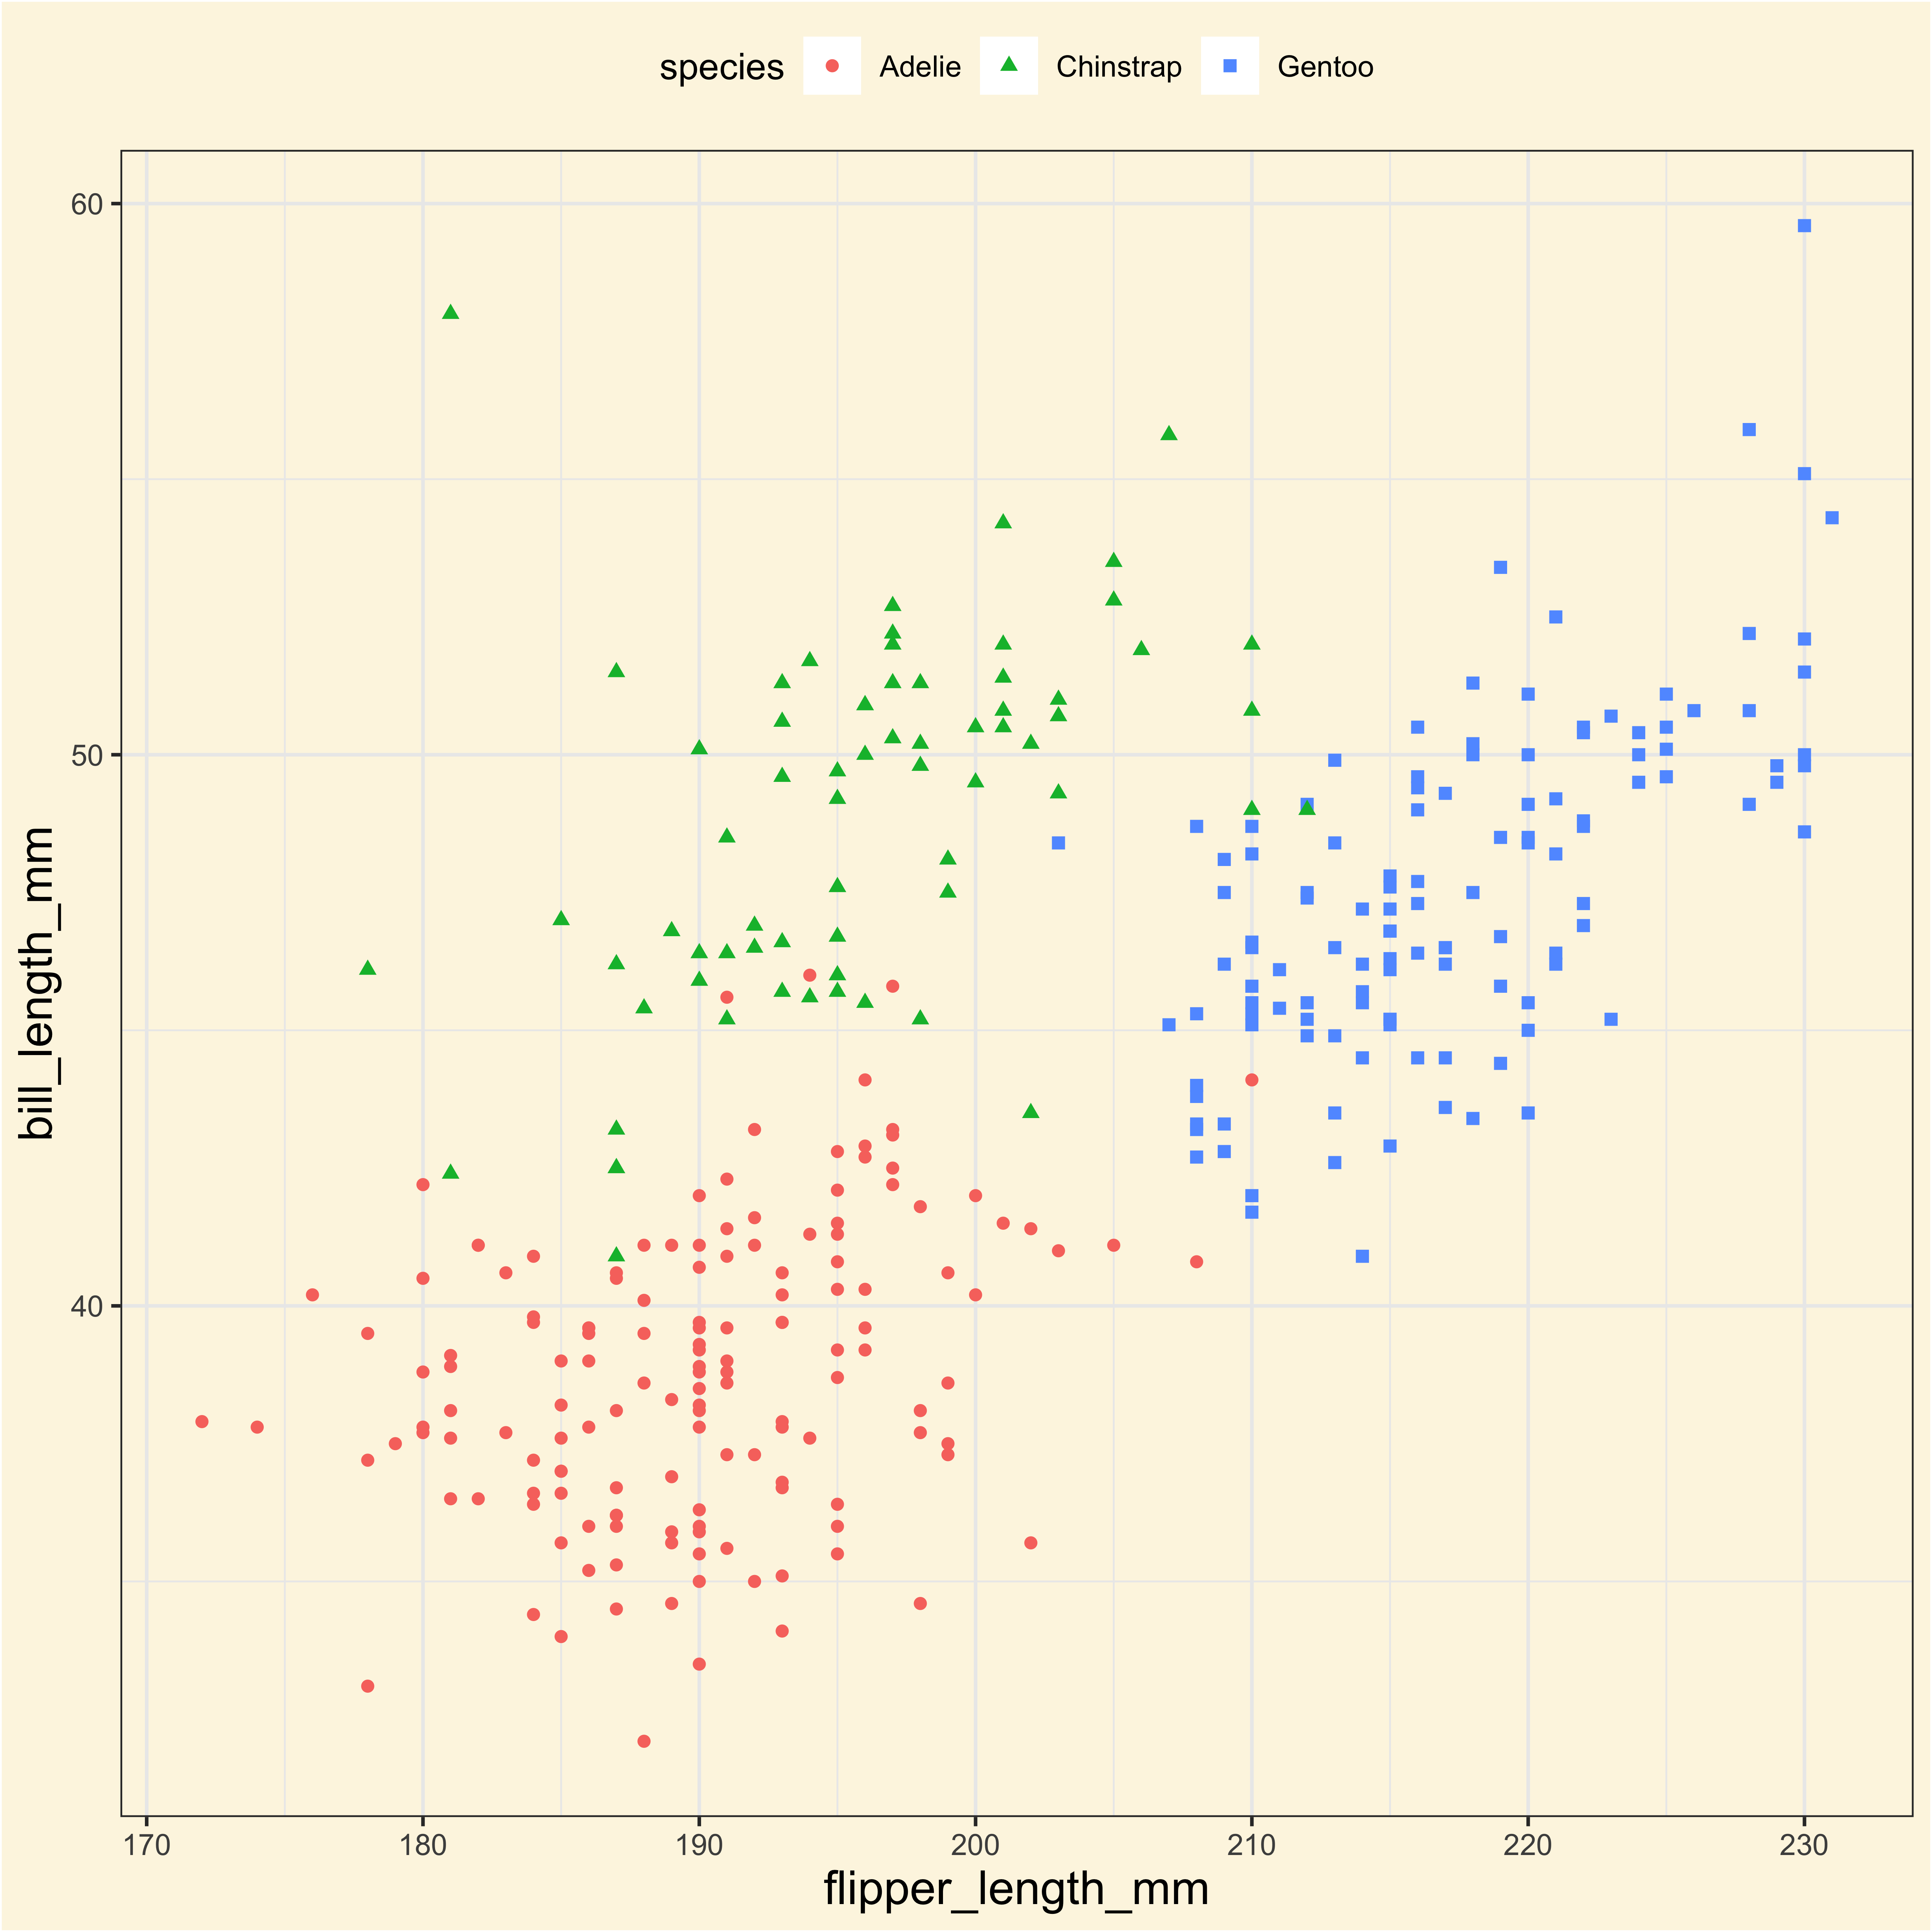
geom_point(
aes(
color = species,
shape = species
)
) +
scale_color_manual(
values = c(
"darkorange",
"purple",
"cyan4"
)
) +
labs(
title = "Flipper and bill length",
subtitle = "Dimensions for Adelie, Chinstrap and Gentoo Penguins at Palmer Station LTER",
x = "Flipper length (mm)",
y = "Bill length (mm)",
color = "Penguin species",
shape = "Penguin species"
)
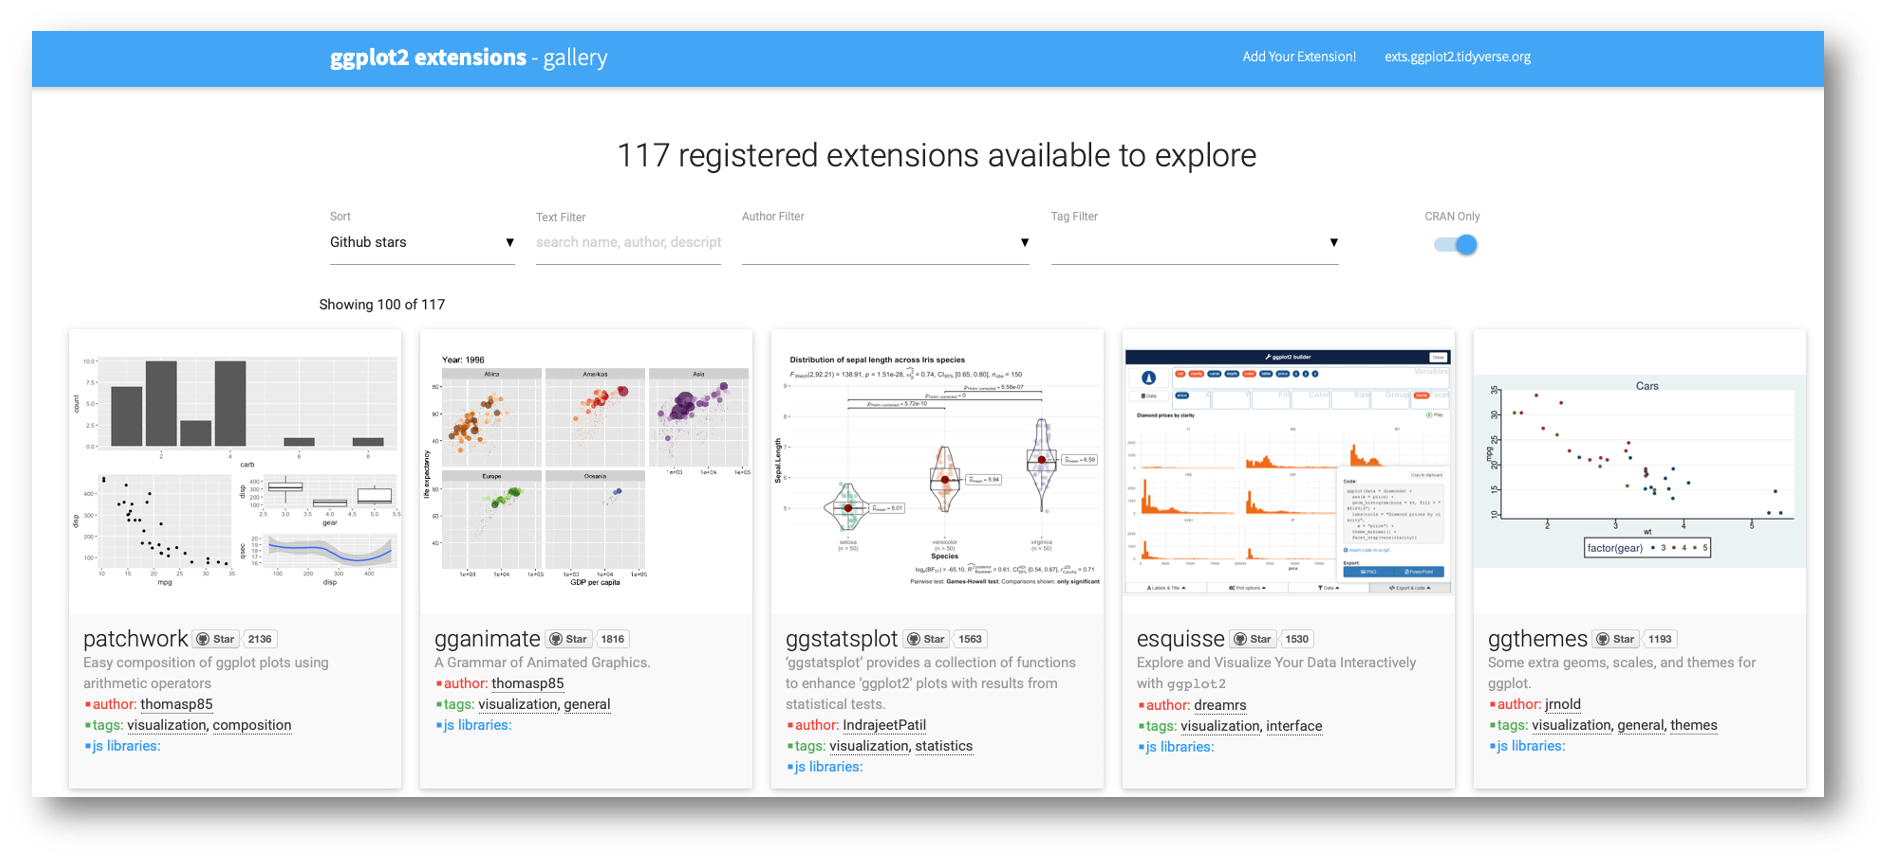
visit in https://exts.ggplot2.tidyverse.org/gallery/