t.test(body_mass_g ~ sex, adelie_penguins)Parametric & Non-Parametric tests
https://bit.ly/3V7CMsZ
Do male penguins display greater body sizes than female?
adelie_penguins <- penguins |>
  filter(species == "Adelie") |>
  drop_na()

ggplot(adelie_penguins, aes(x = sex, y = body_mass_g, fill = sex)) +
  geom_boxplot(alpha = 0.5) +
  geom_jitter(width = 0.2) +
  labs(
    y = "Body mass (g)",
    x = ""
  )


Then,

And,

\[ \bar{X}_{1} - \bar{X}_{2} \sim N\Bigg[\mu_{1} - \mu_{2},s^{2}\bigg(\frac{1}{n_{1}}+\frac{1}{n_{2}}\bigg)\Bigg] \]
If \(H_{0}\) is true \(\rightarrow\) \(\mu_{1} - \mu_{2} = 0\), then
\[ \bar{X}_{1} - \bar{X}_{2} \sim N\Bigg[0,s^{2}\bigg(\frac{1}{n_{1}}+\frac{1}{n_{2}}\bigg)\Bigg] \]
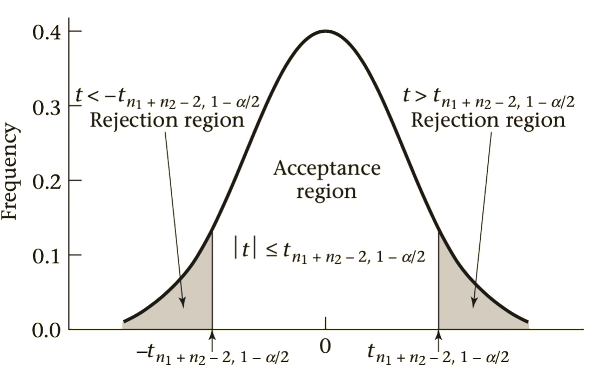
\[ \frac{\bar{X}_{1} - \bar{X}_{2}}{s\sqrt{\frac{1}{n_{1}}+\frac{1}{n_{2}}}} \sim N(0,1) \]
\[ \frac{\bar{X}_{1} - \bar{X}_{2}}{s\sqrt{\frac{1}{n_{1}}+\frac{1}{n_{2}}}} = t \]
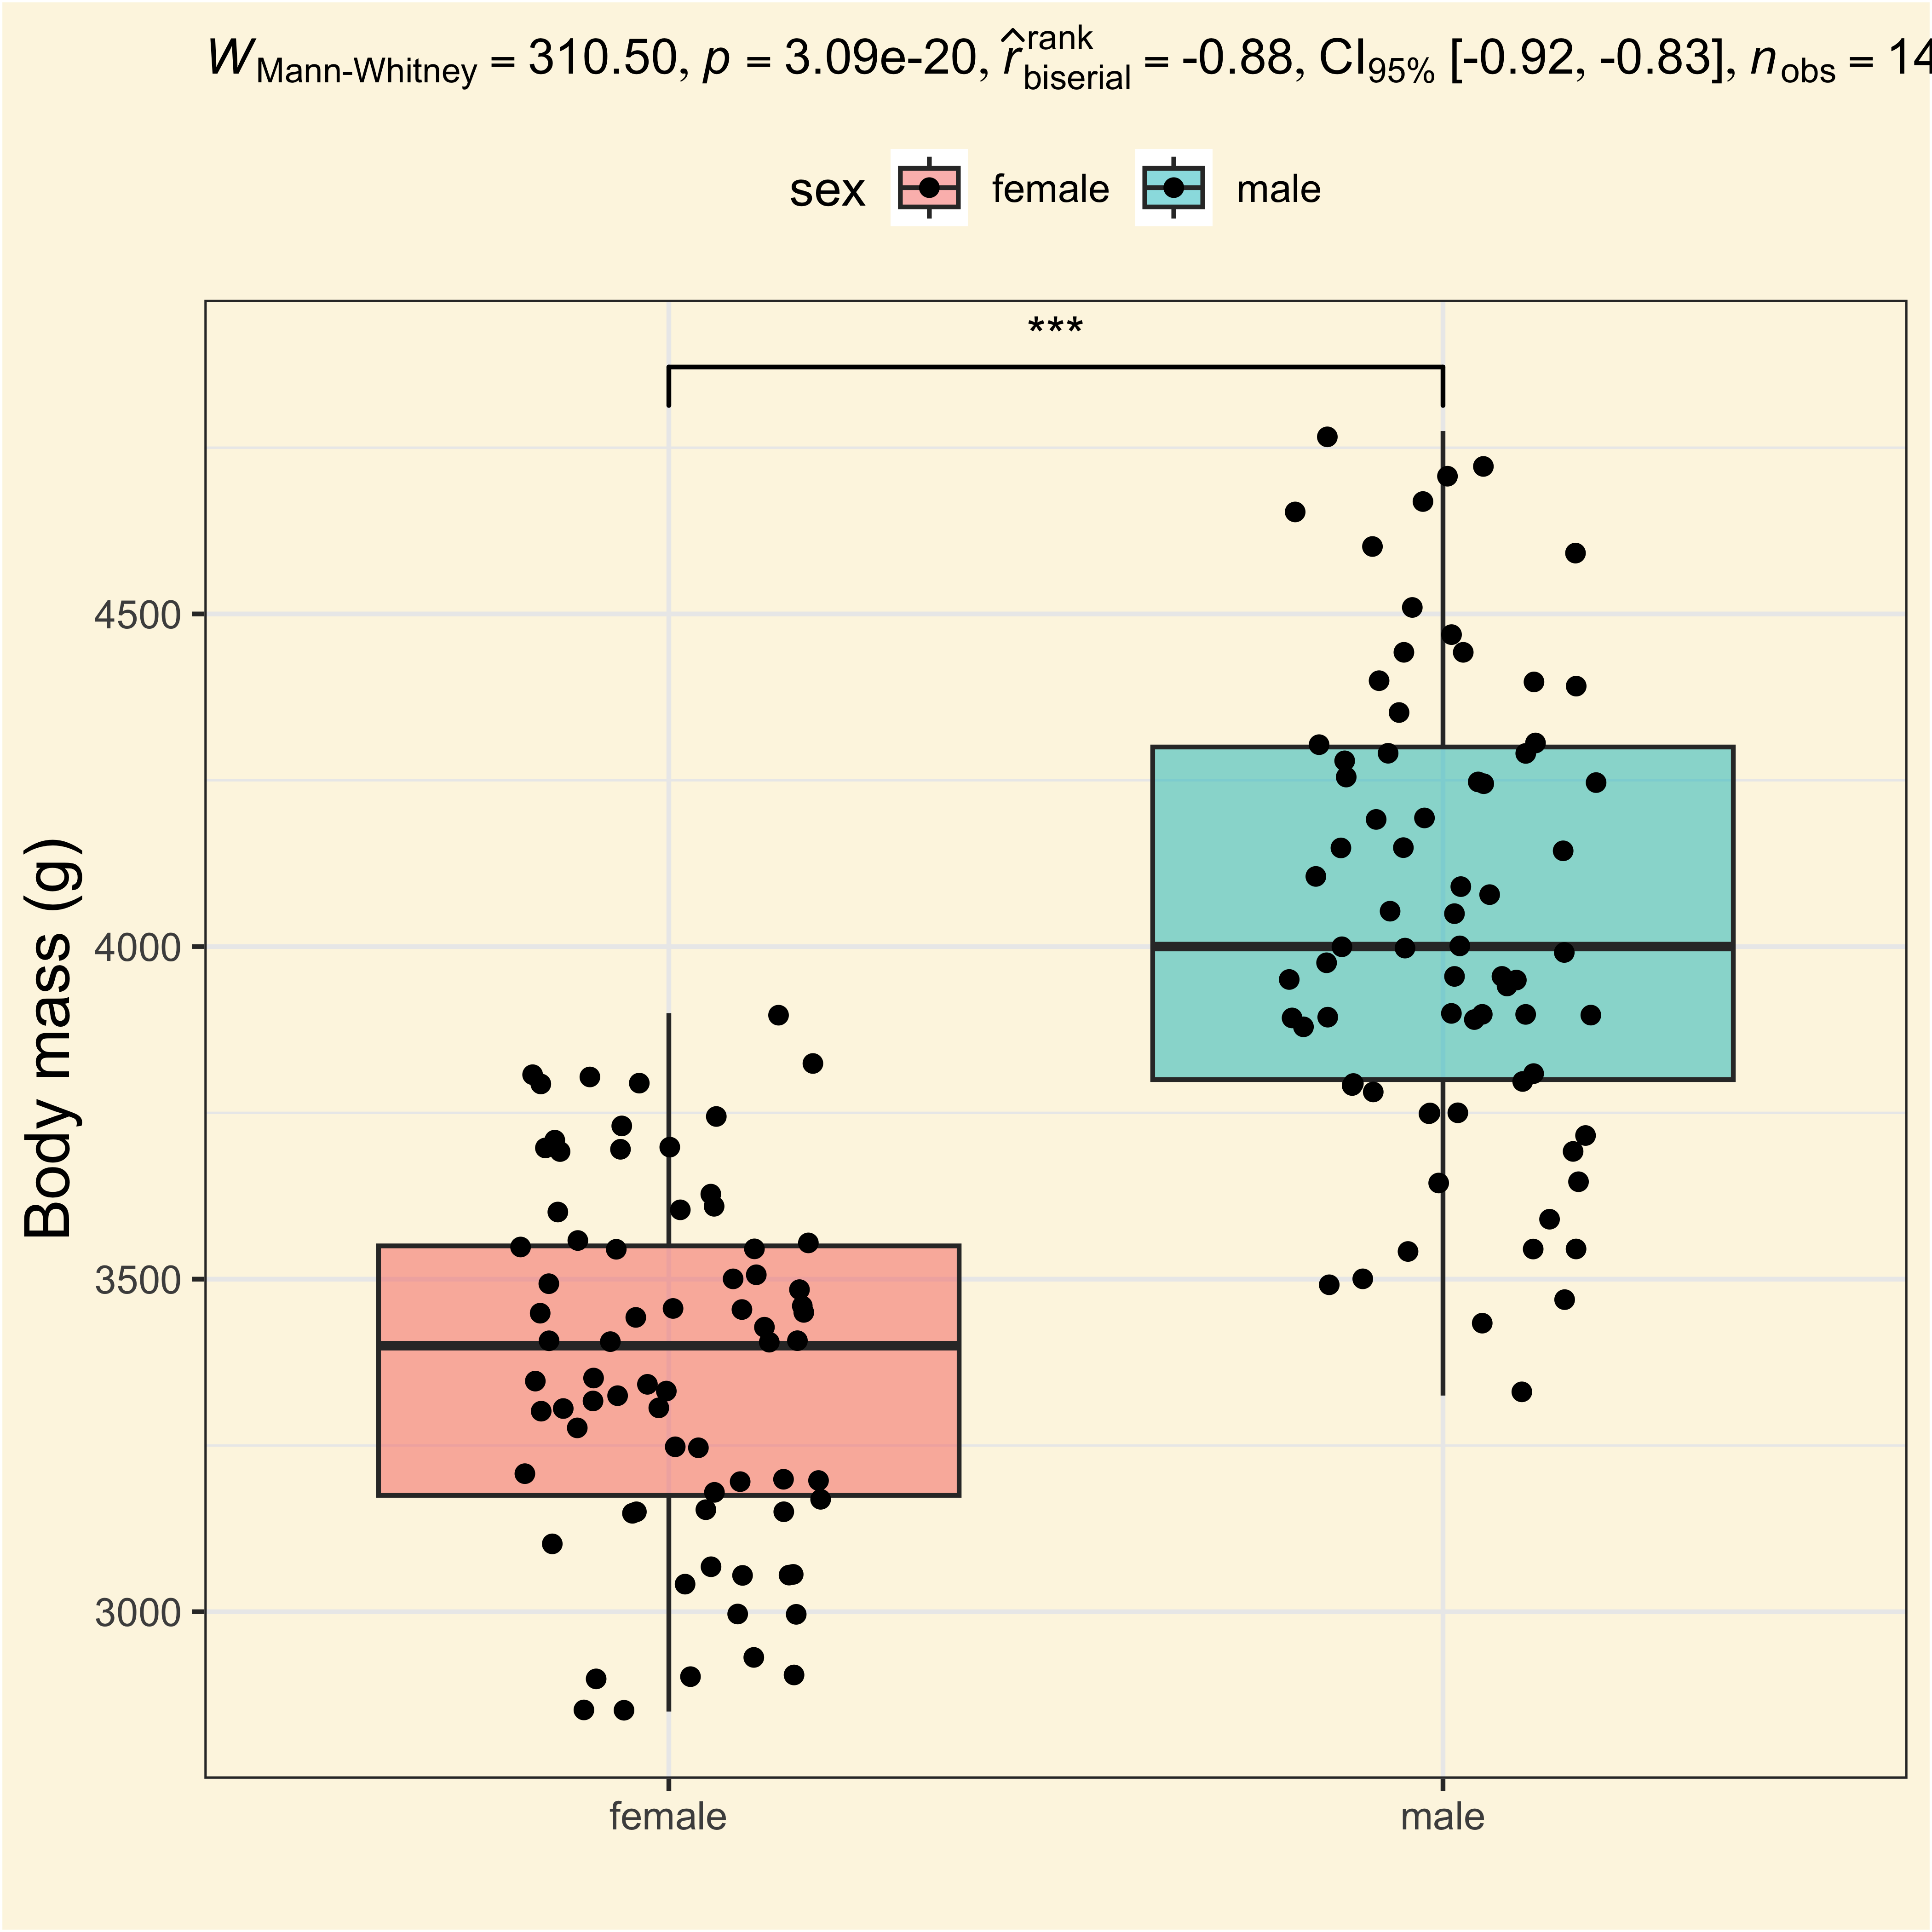
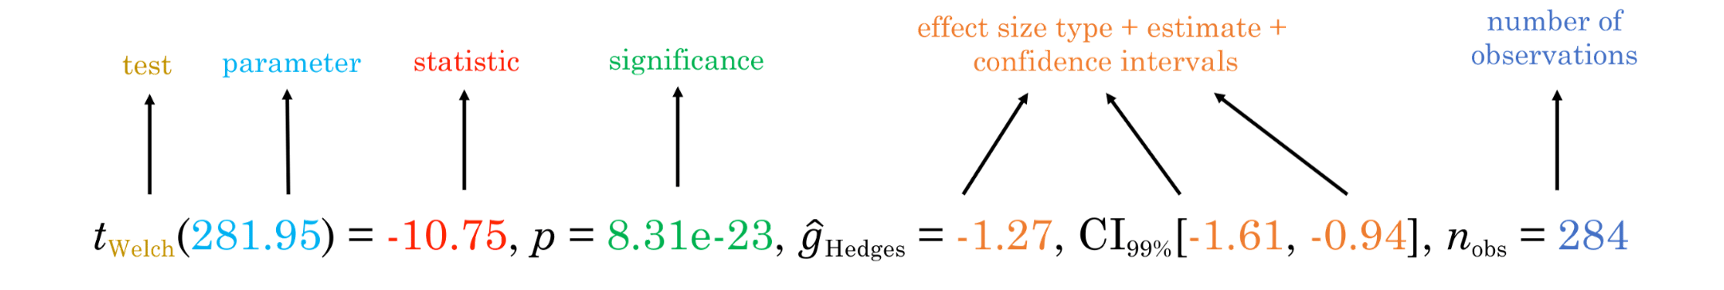
Another alternative is to use the statsExpressions library:

ggplot(
  adelie_penguins,
  aes(
    x = sex,
    y = body_mass_g,
    fill = sex
  )
) +
  geom_boxplot(alpha = 0.5) +
  geom_jitter(width = 0.2) +
  labs(
    y = "Body mass (g)",
    x = "",
    subtitle = parse(
      text = adelie_ttest_table$expression
    )
) +
geom_signif(
comparisons = list(c("female", "male")),
test = "t.test",
map_signif_level = TRUE
)
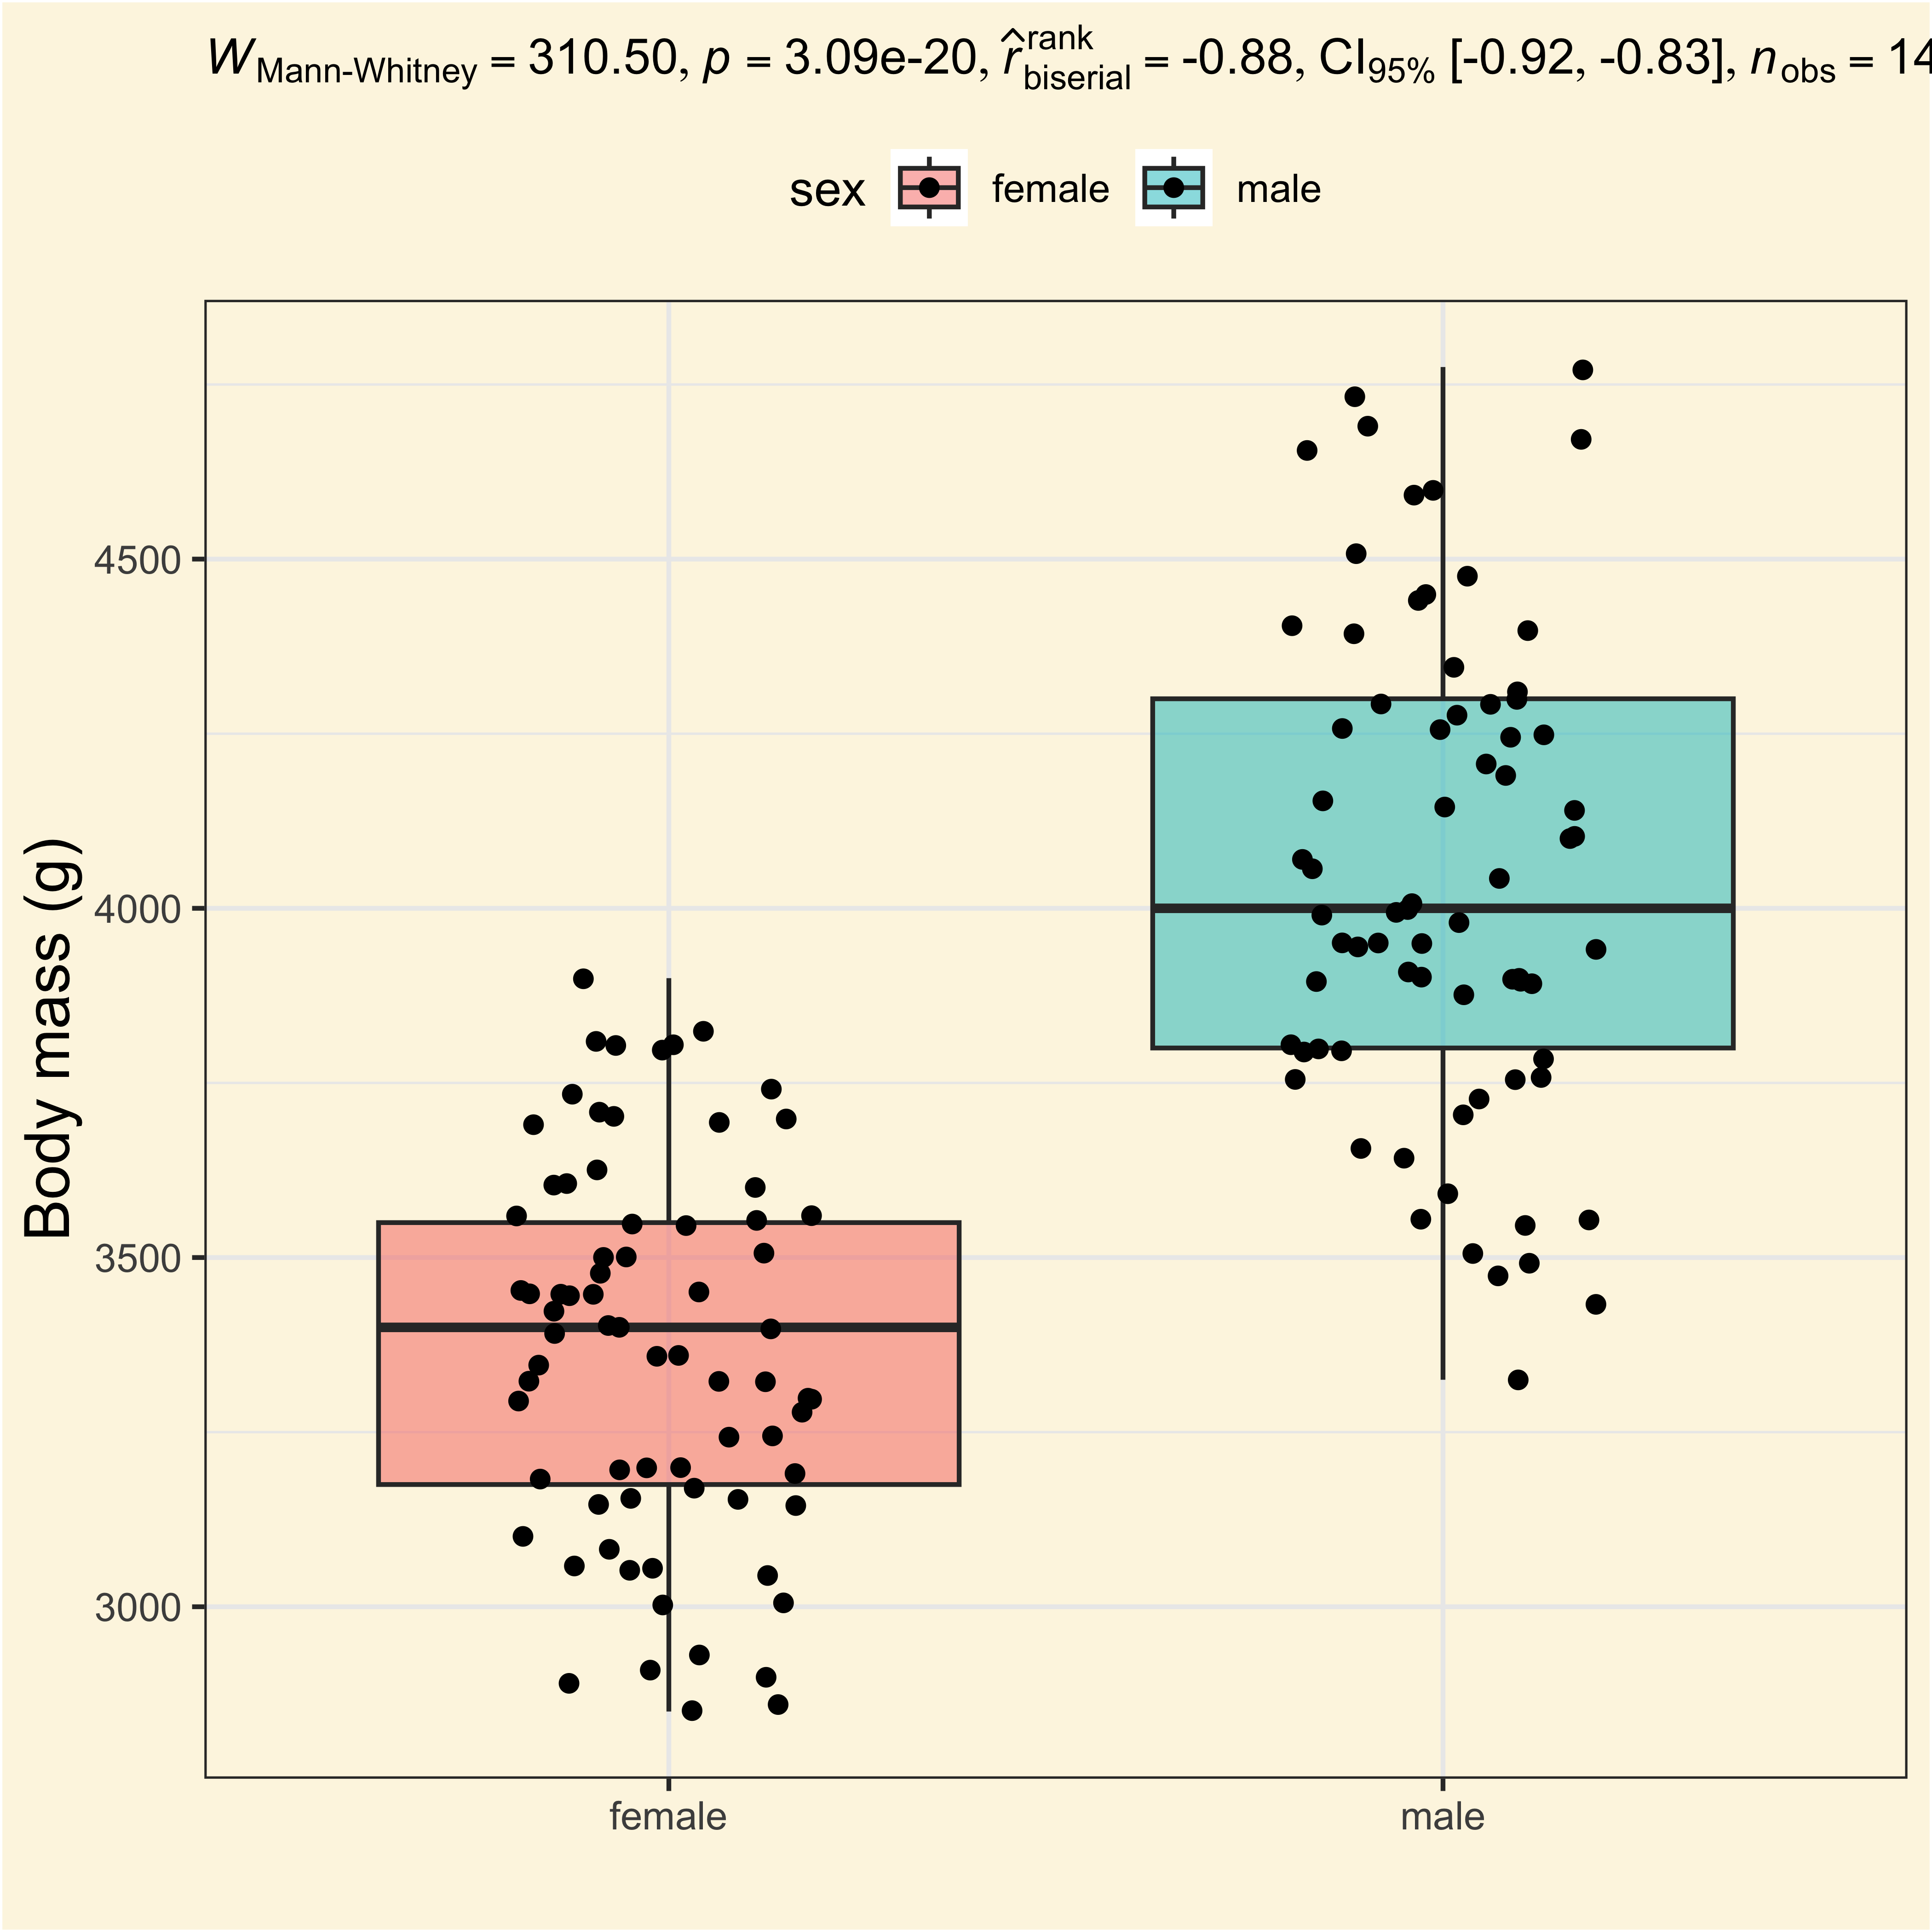
ggplot(
  adelie_penguins,
  aes(
    x = sex,
    y = body_mass_g,
    fill = sex
  )
) +
  geom_boxplot(alpha = 0.5) +
  geom_jitter(width = 0.2) +
  labs(
    y = "Body mass (g)",
    x = "",
    subtitle = parse(
      text = adelie_wilcox_table$expression
    )
) +
geom_signif(
comparisons = list(c("female", "male")),
test = "wilcox.test",
map_signif_level = TRUE
)