Permutation tests & Bootstrap
https://bit.ly/424cydp
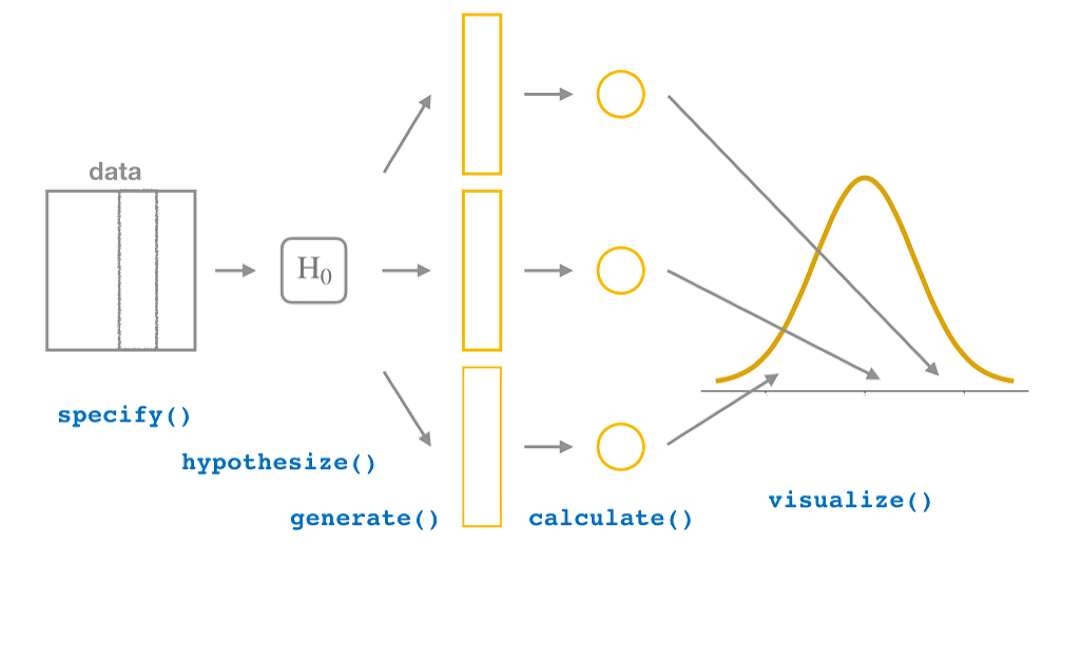
The four infer verbs:
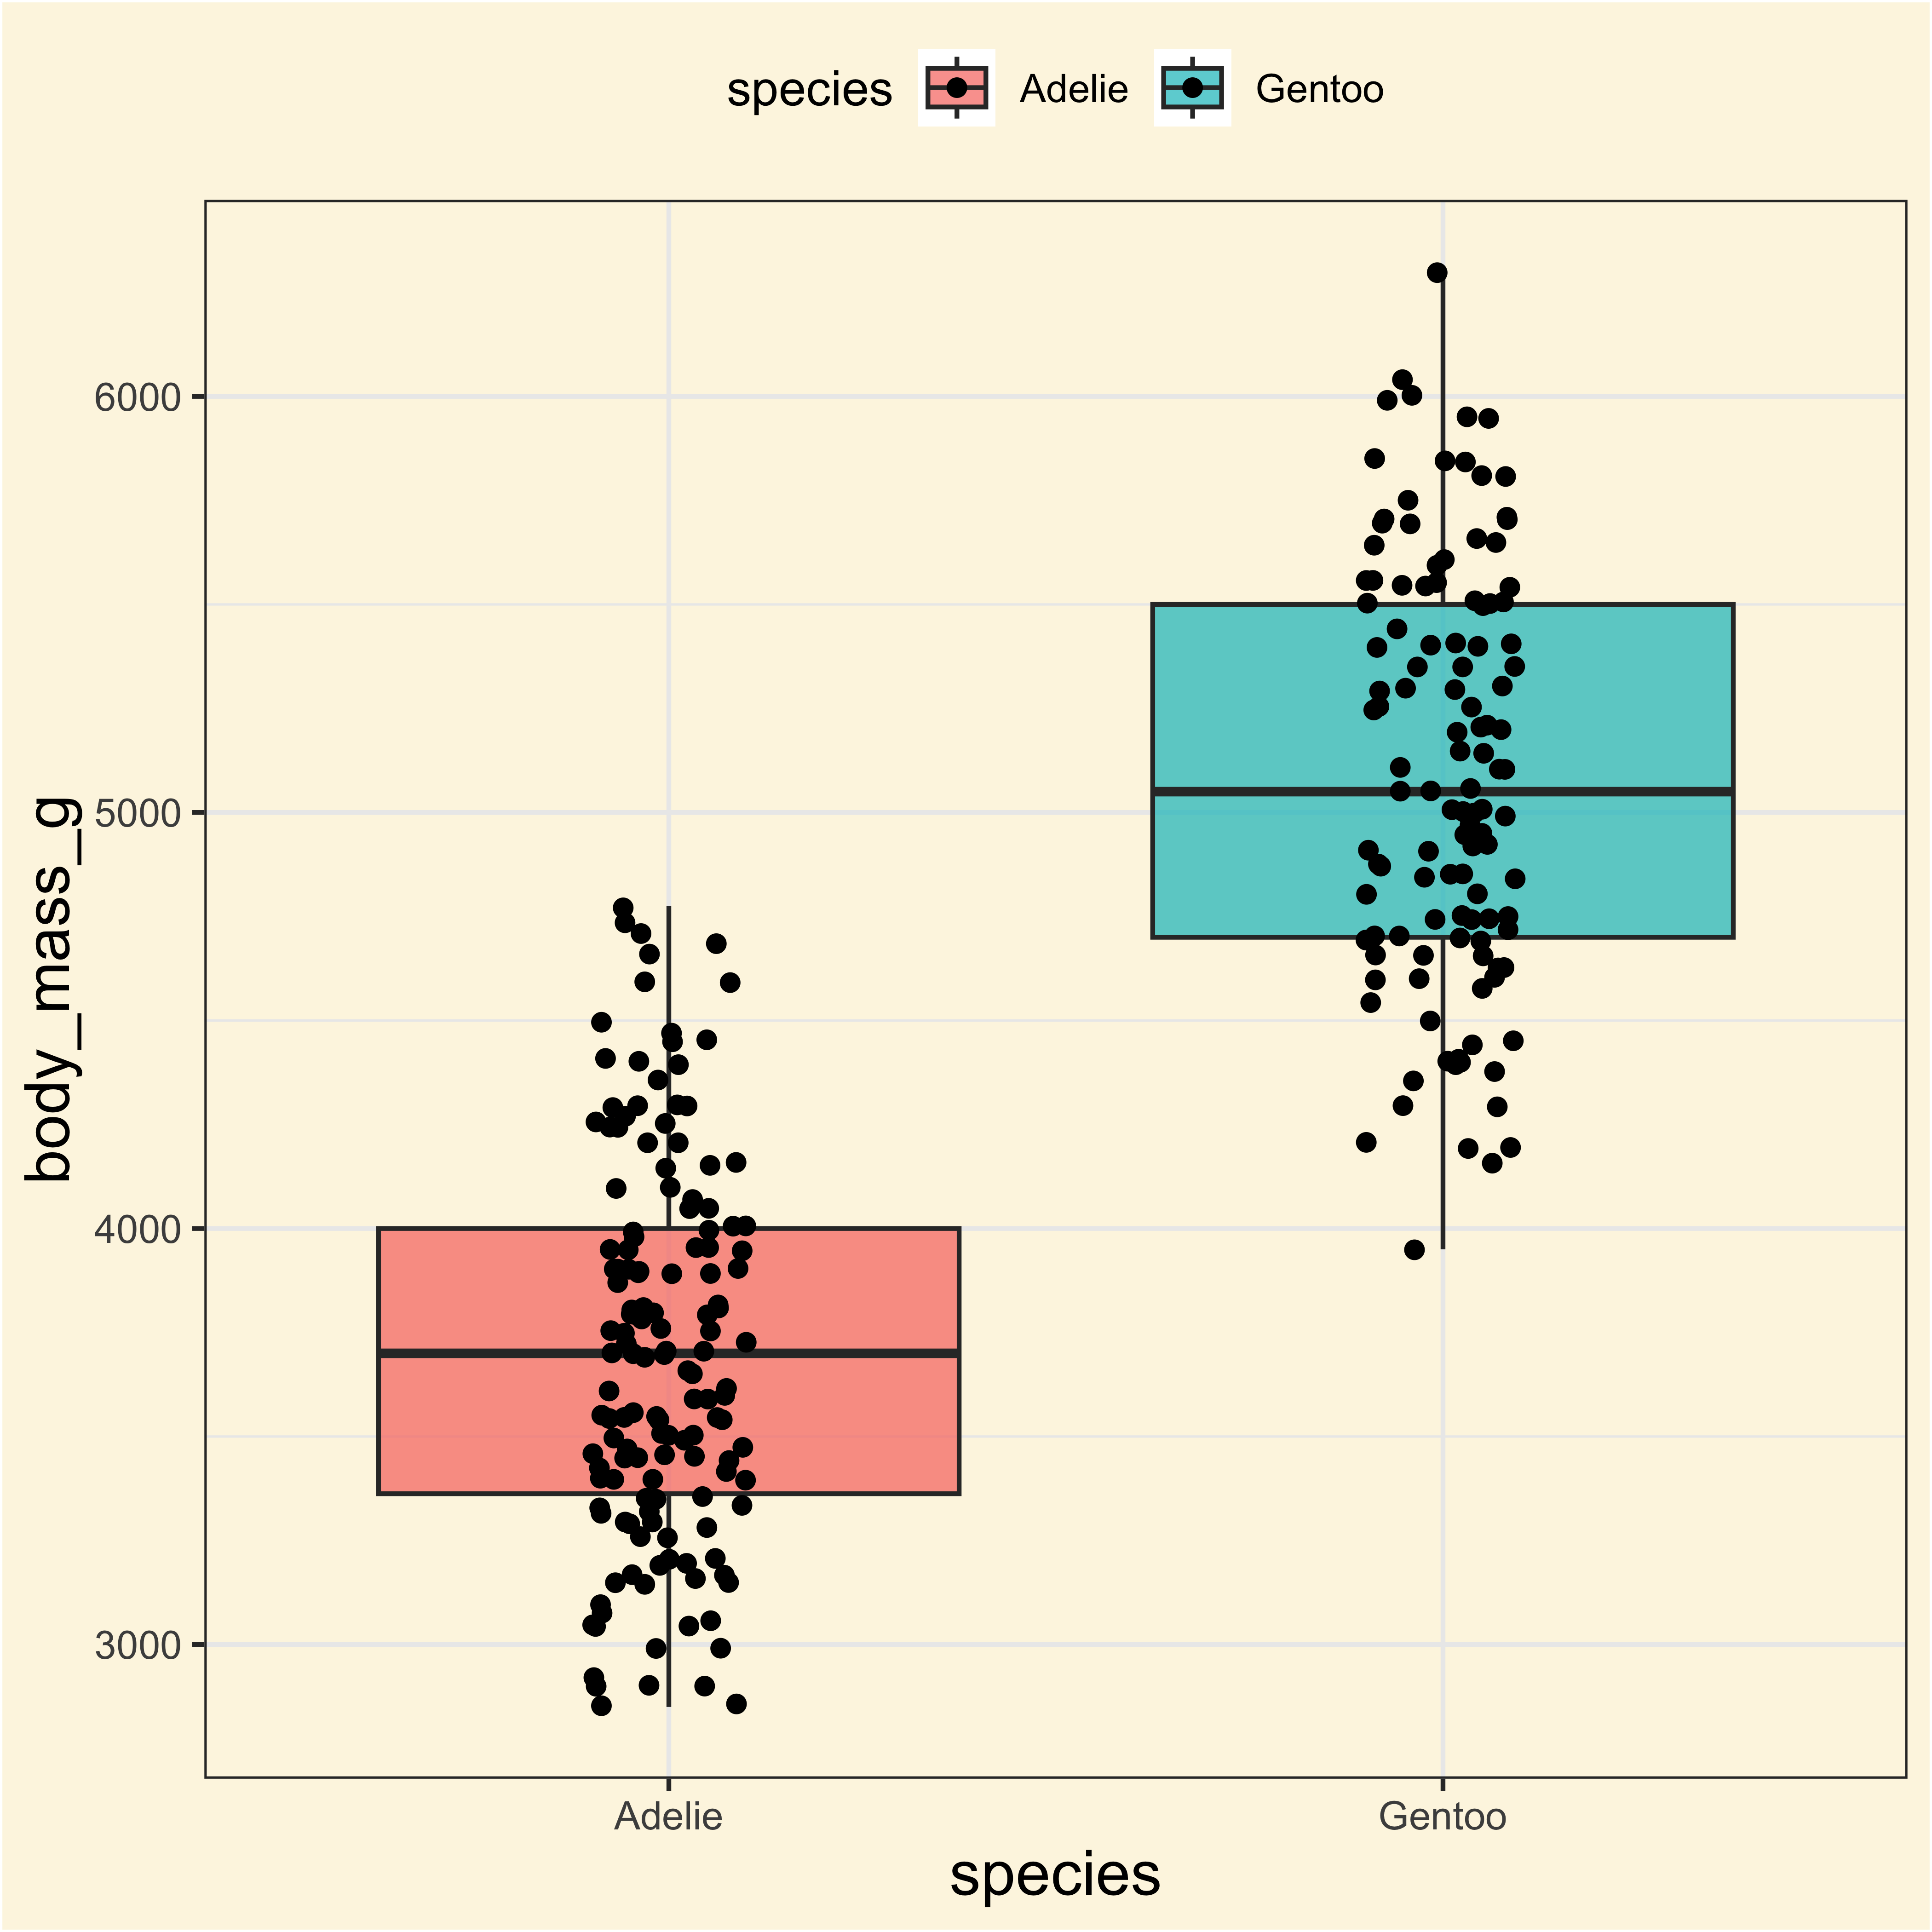
Adelie and Gentoo
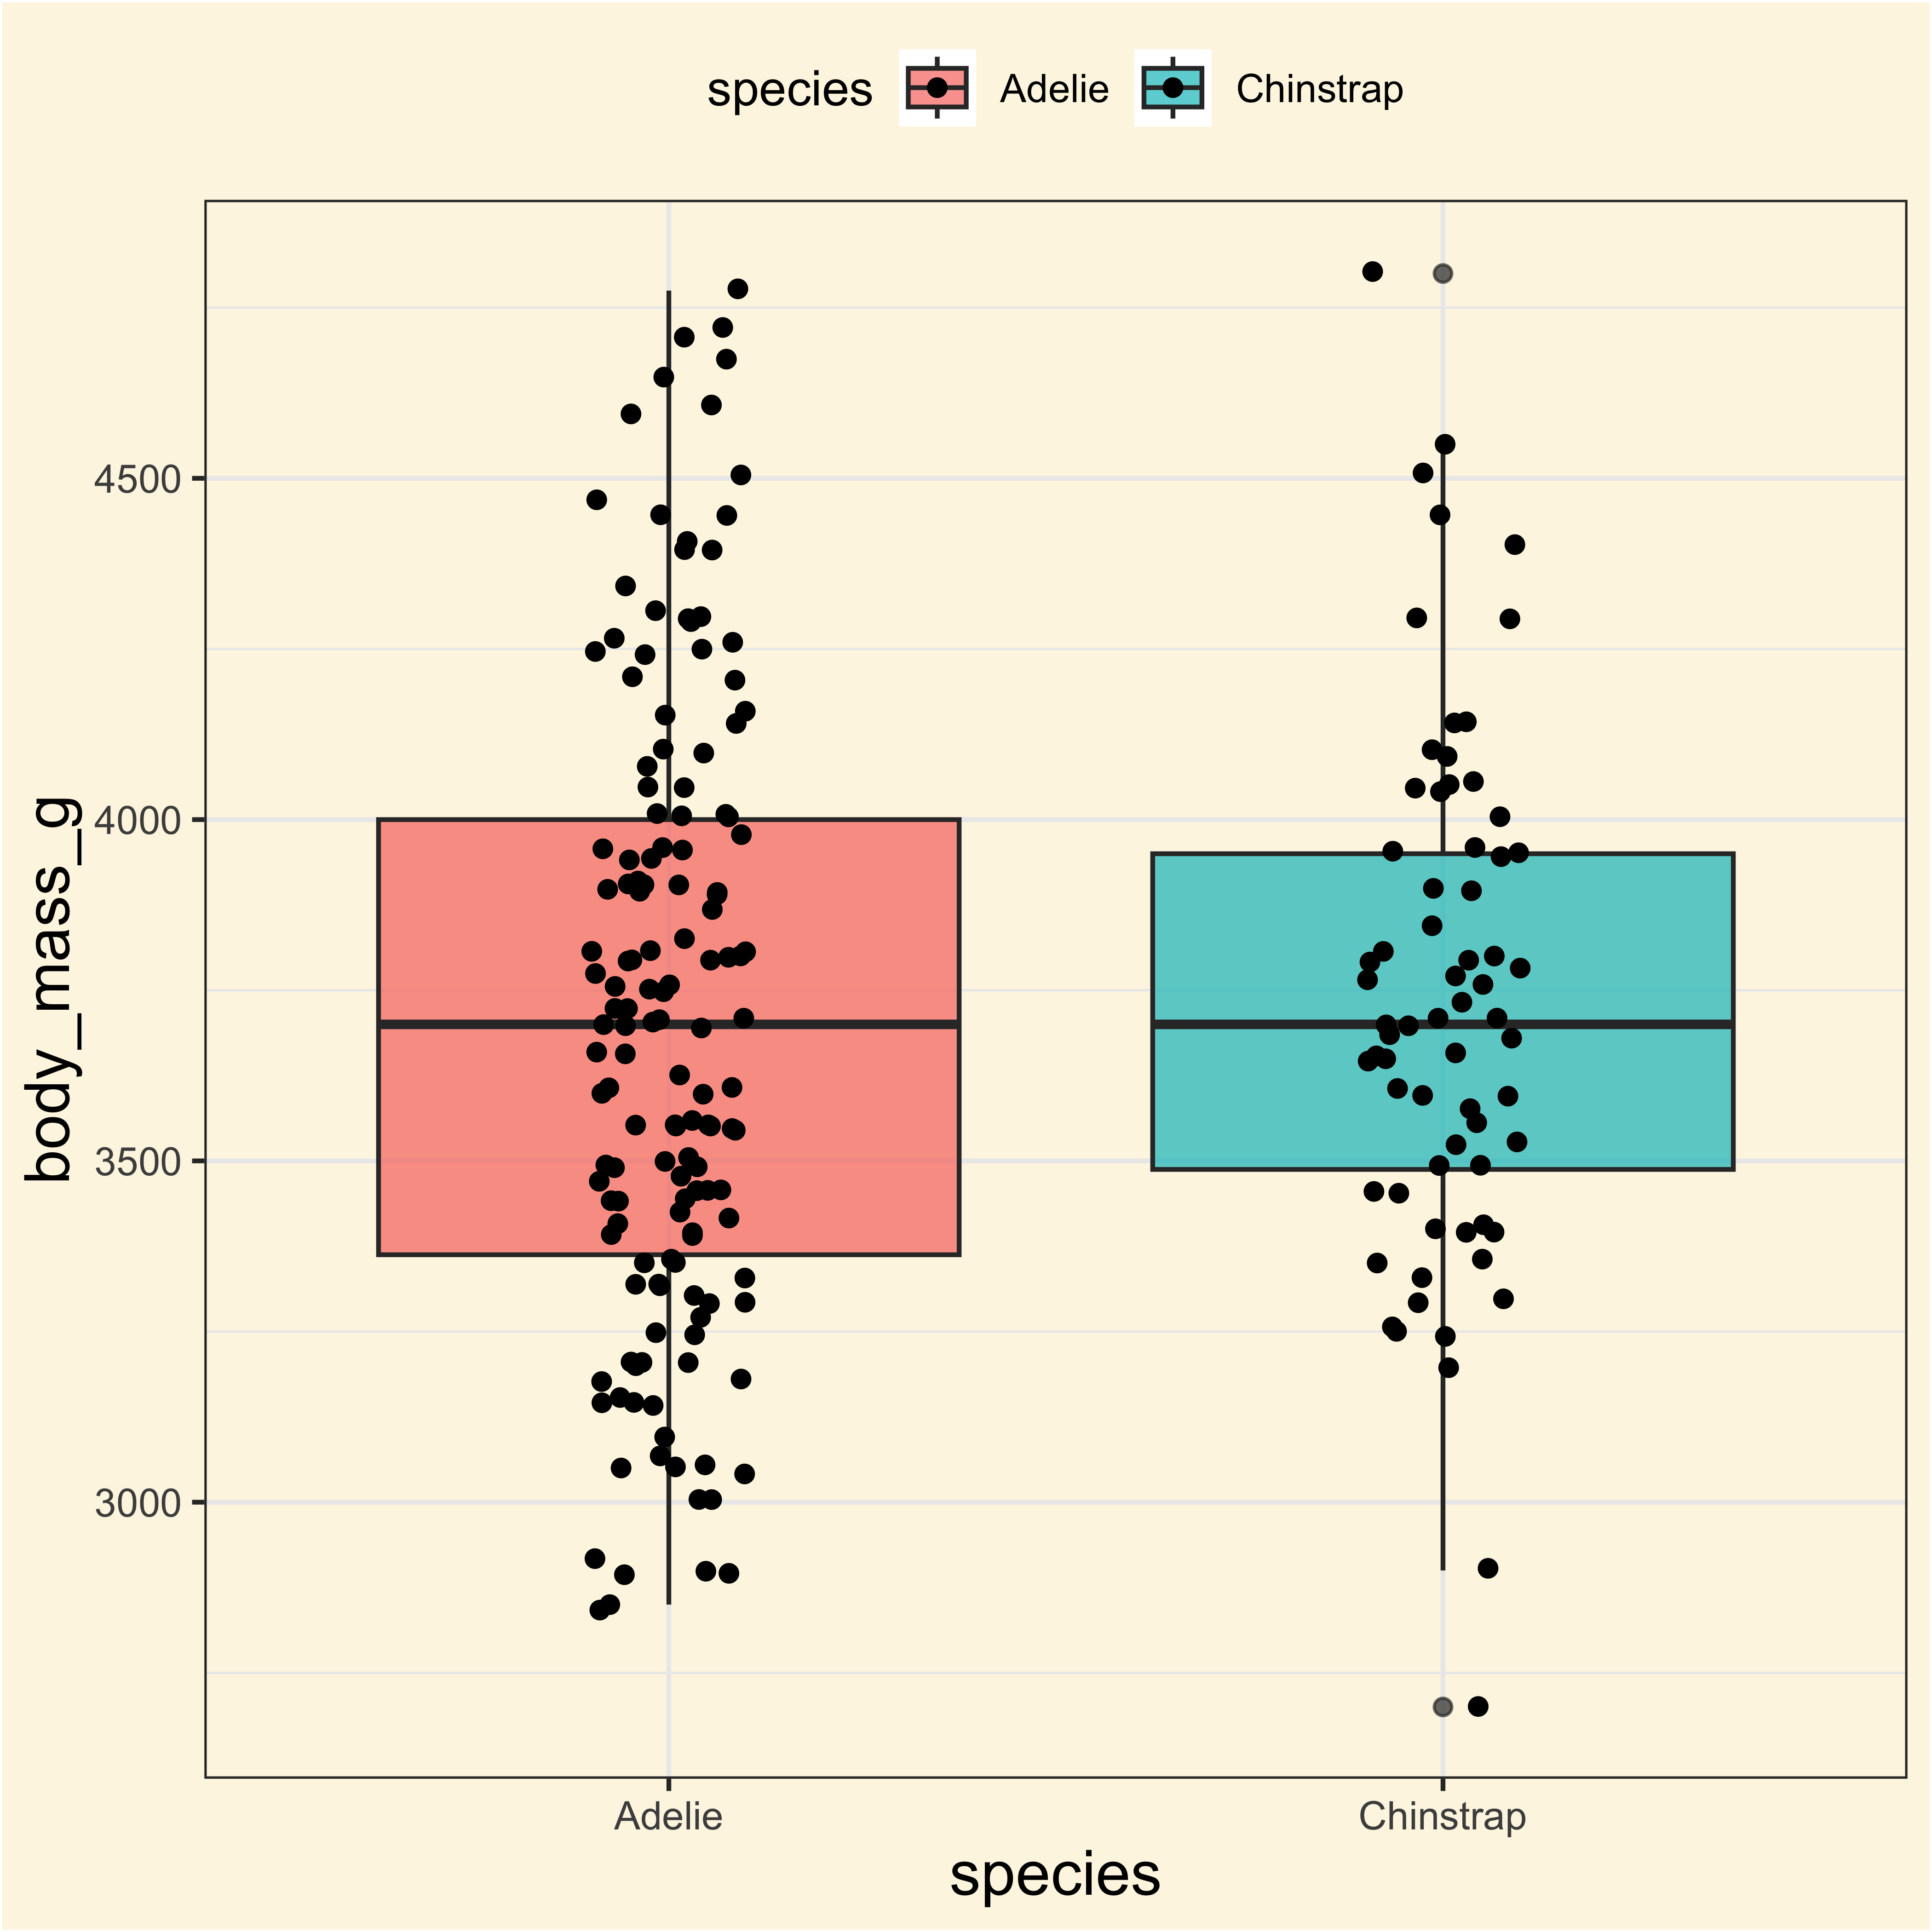
Adelie and Chinstrap
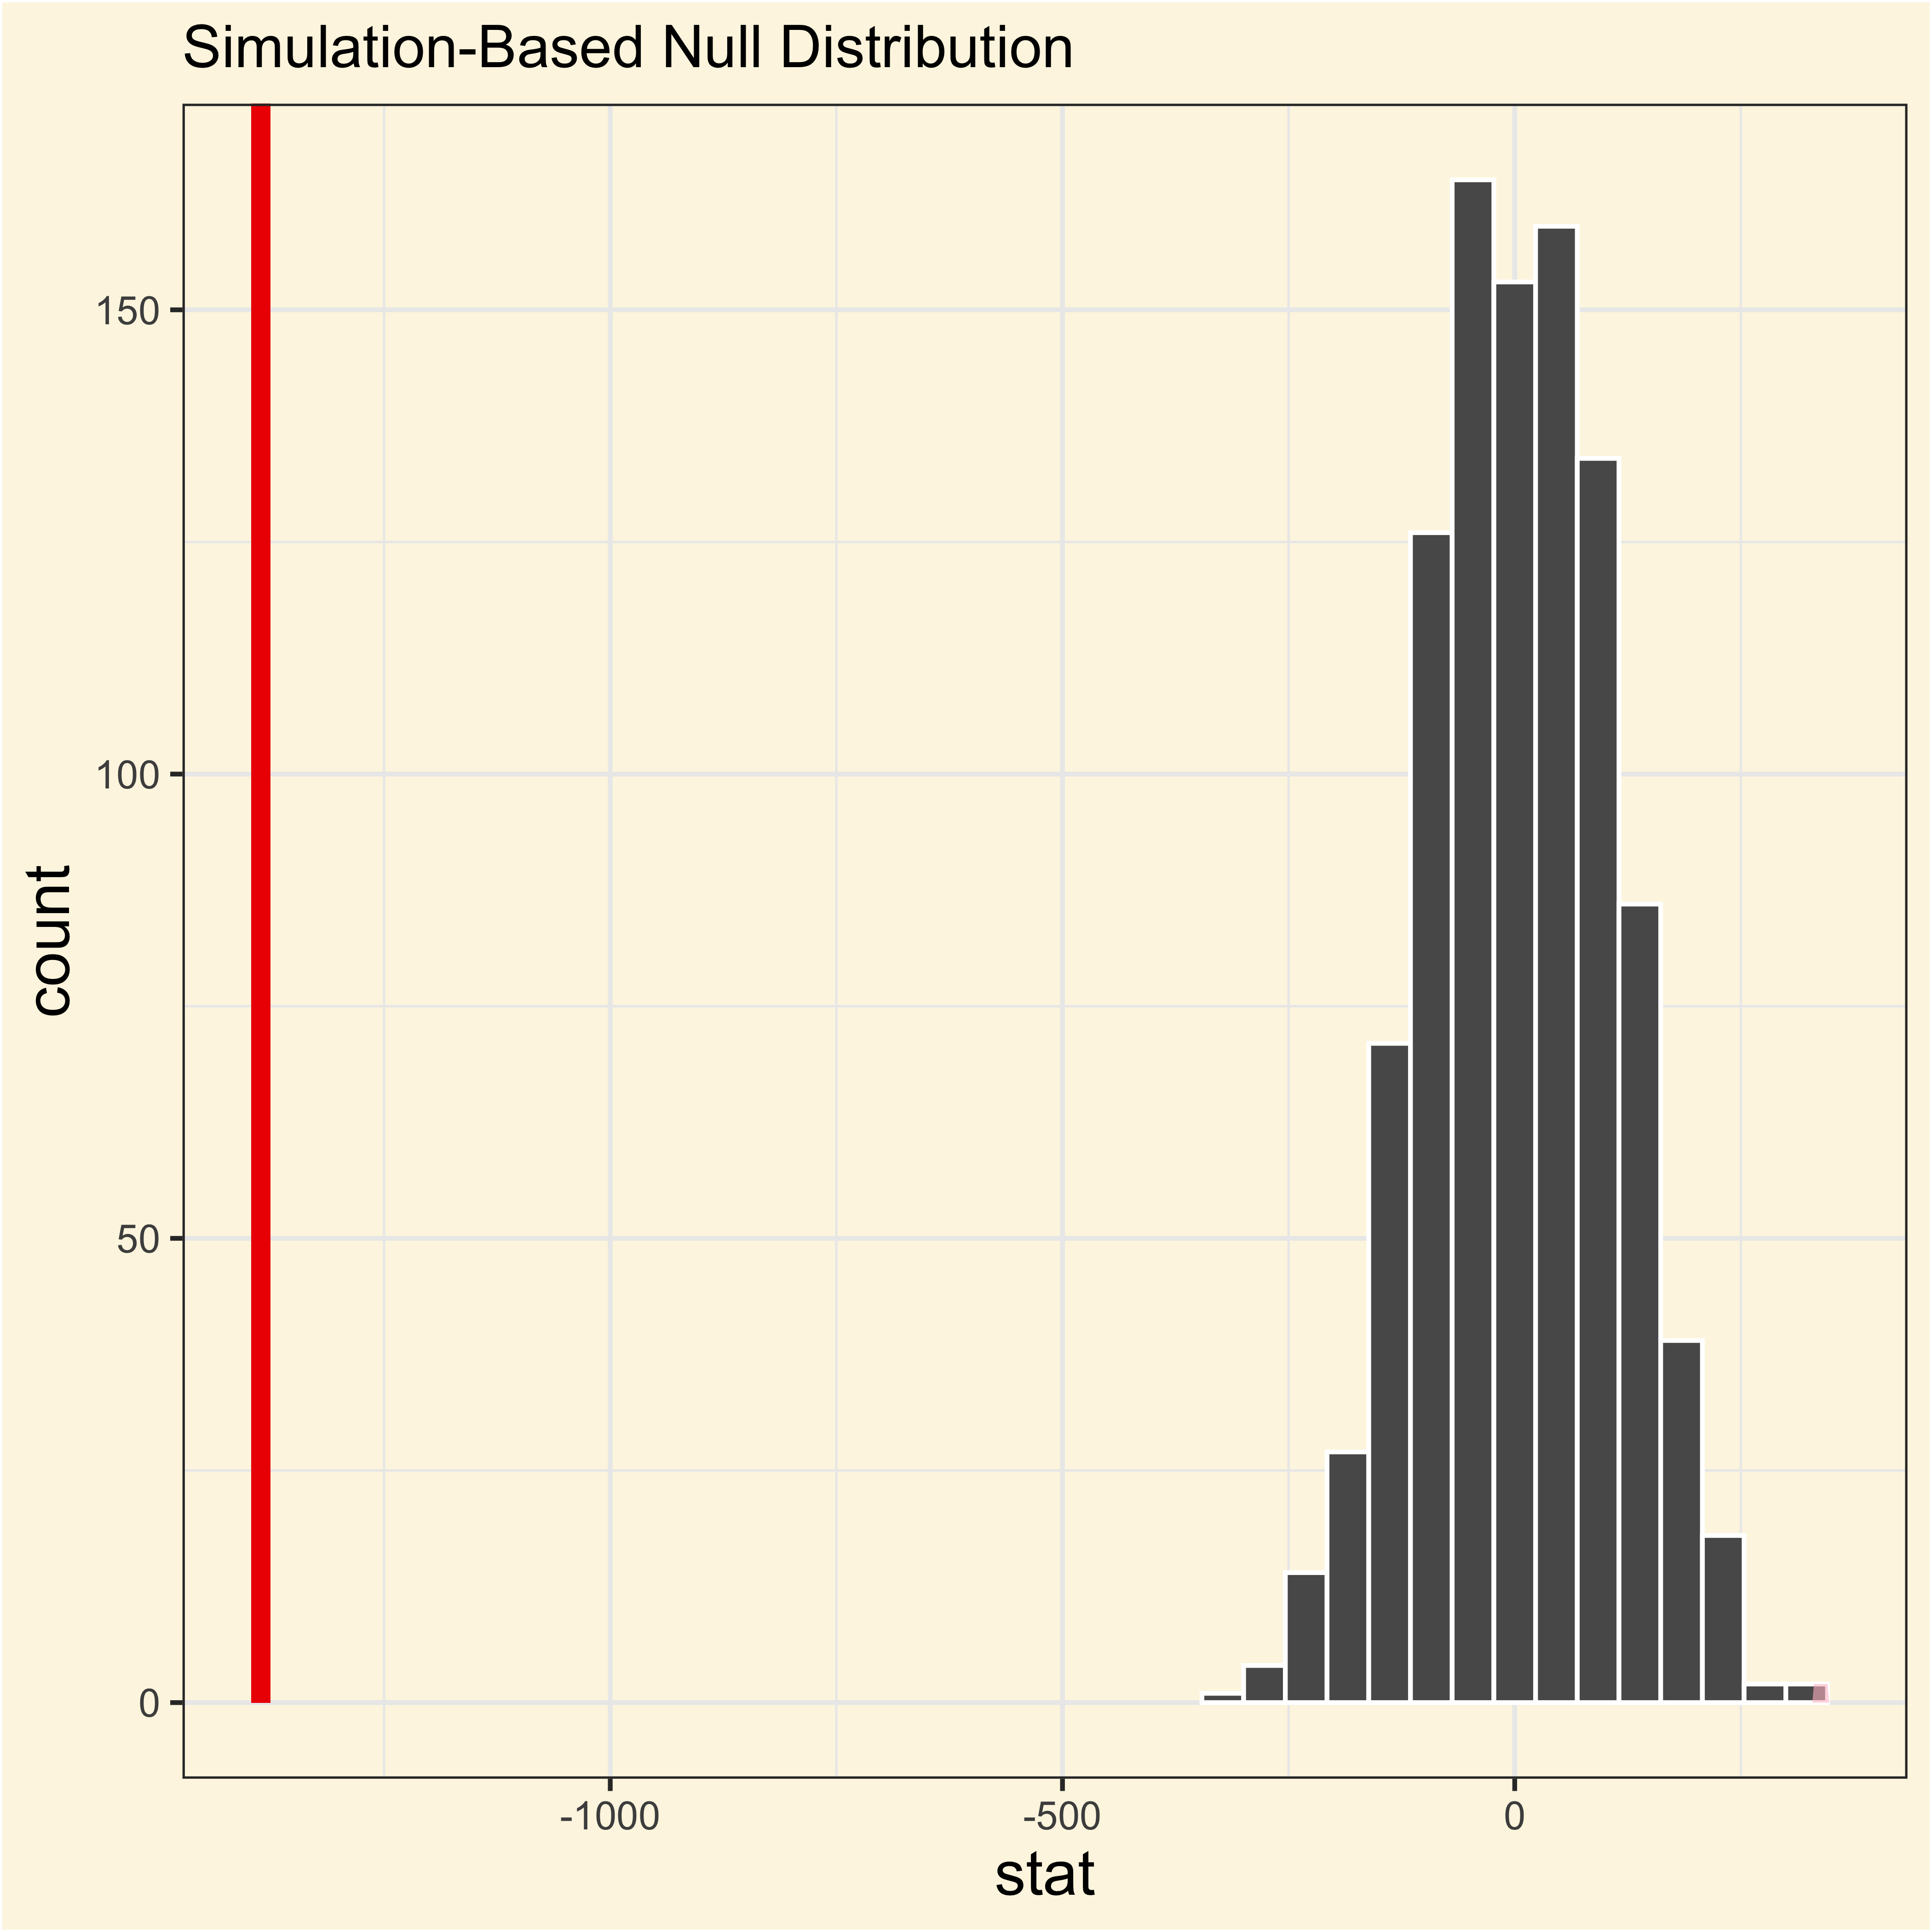
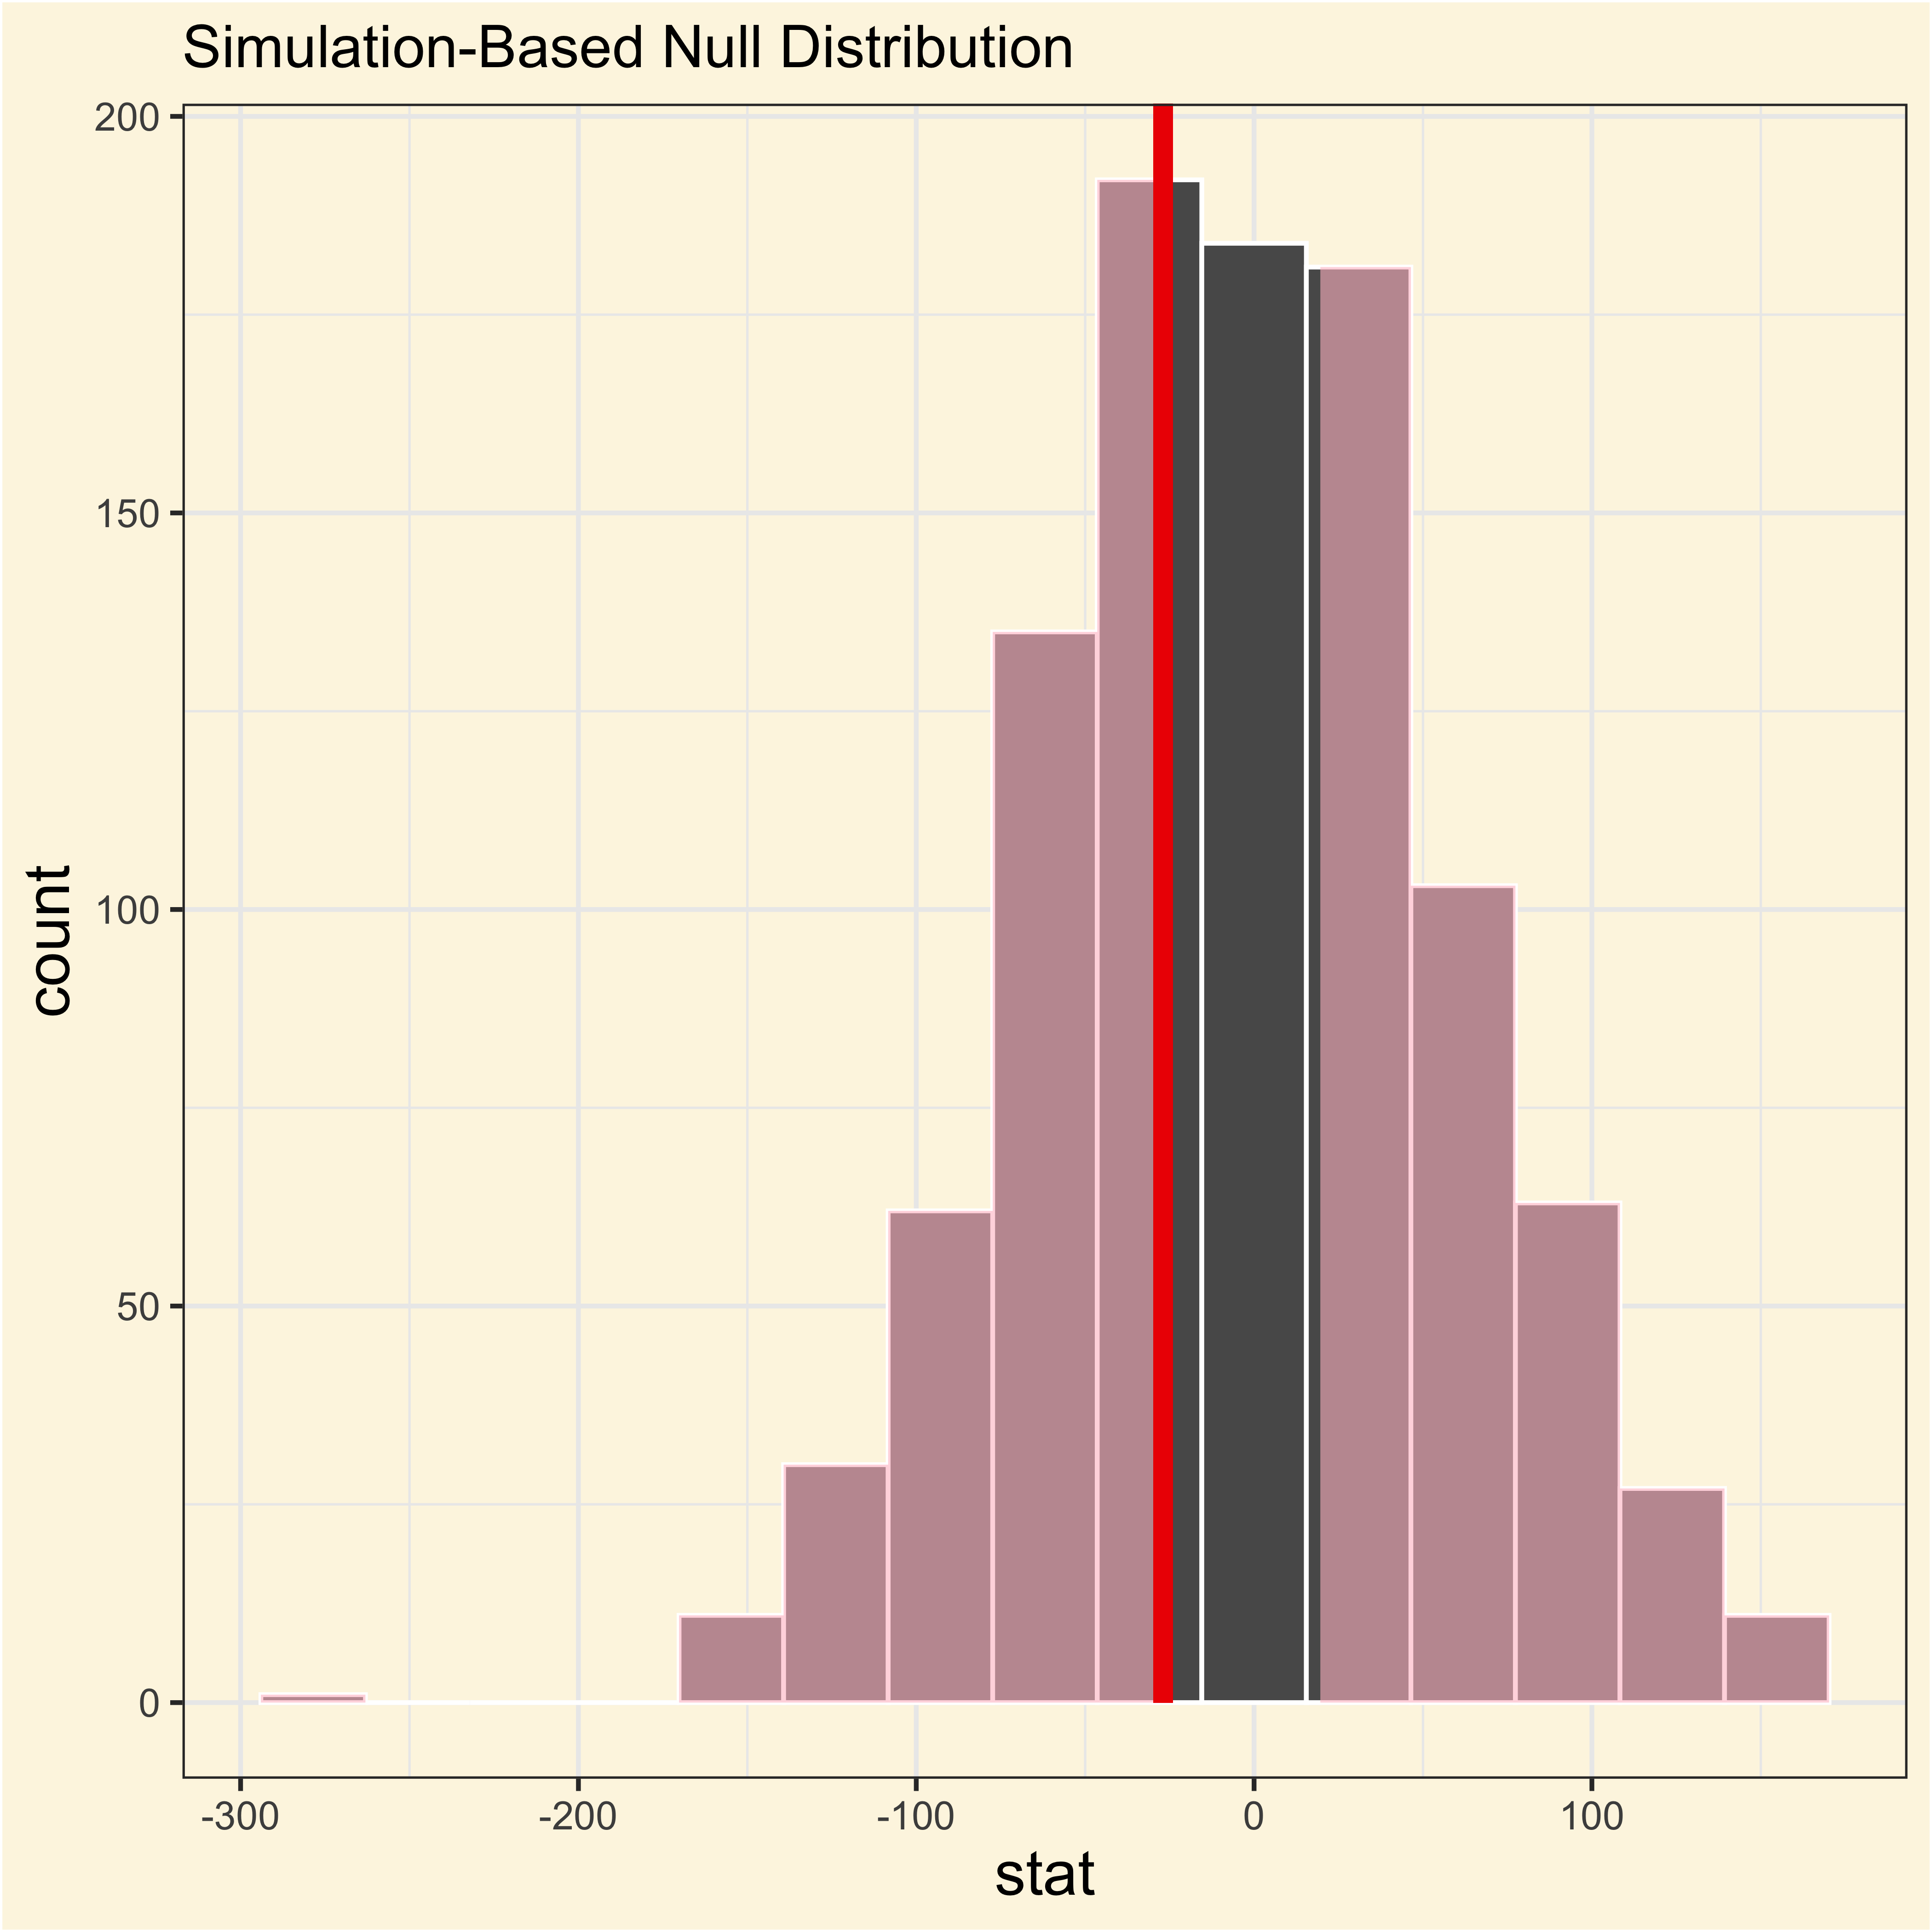
- Visualize the observed statistic against the null distribution:
Adelie and Gentoo
Code
visualize(adelie_gentoo_null) +
  shade_p_value(
    obs_stat = adelie_gentoo_observed,
    direction = "two-sided"
    )
Adelie and Chinstrap
Code
visualize(adelie_chinstrap_null) +
  shade_p_value(
    obs_stat = adelie_chinstrap_observed,
    direction = "two-sided"
    )
Adelie and Chinstrap
Code
adelie_chinstrap_bootstrap |>
  visualize() +
  shade_confidence_interval(endpoints = ac_ci)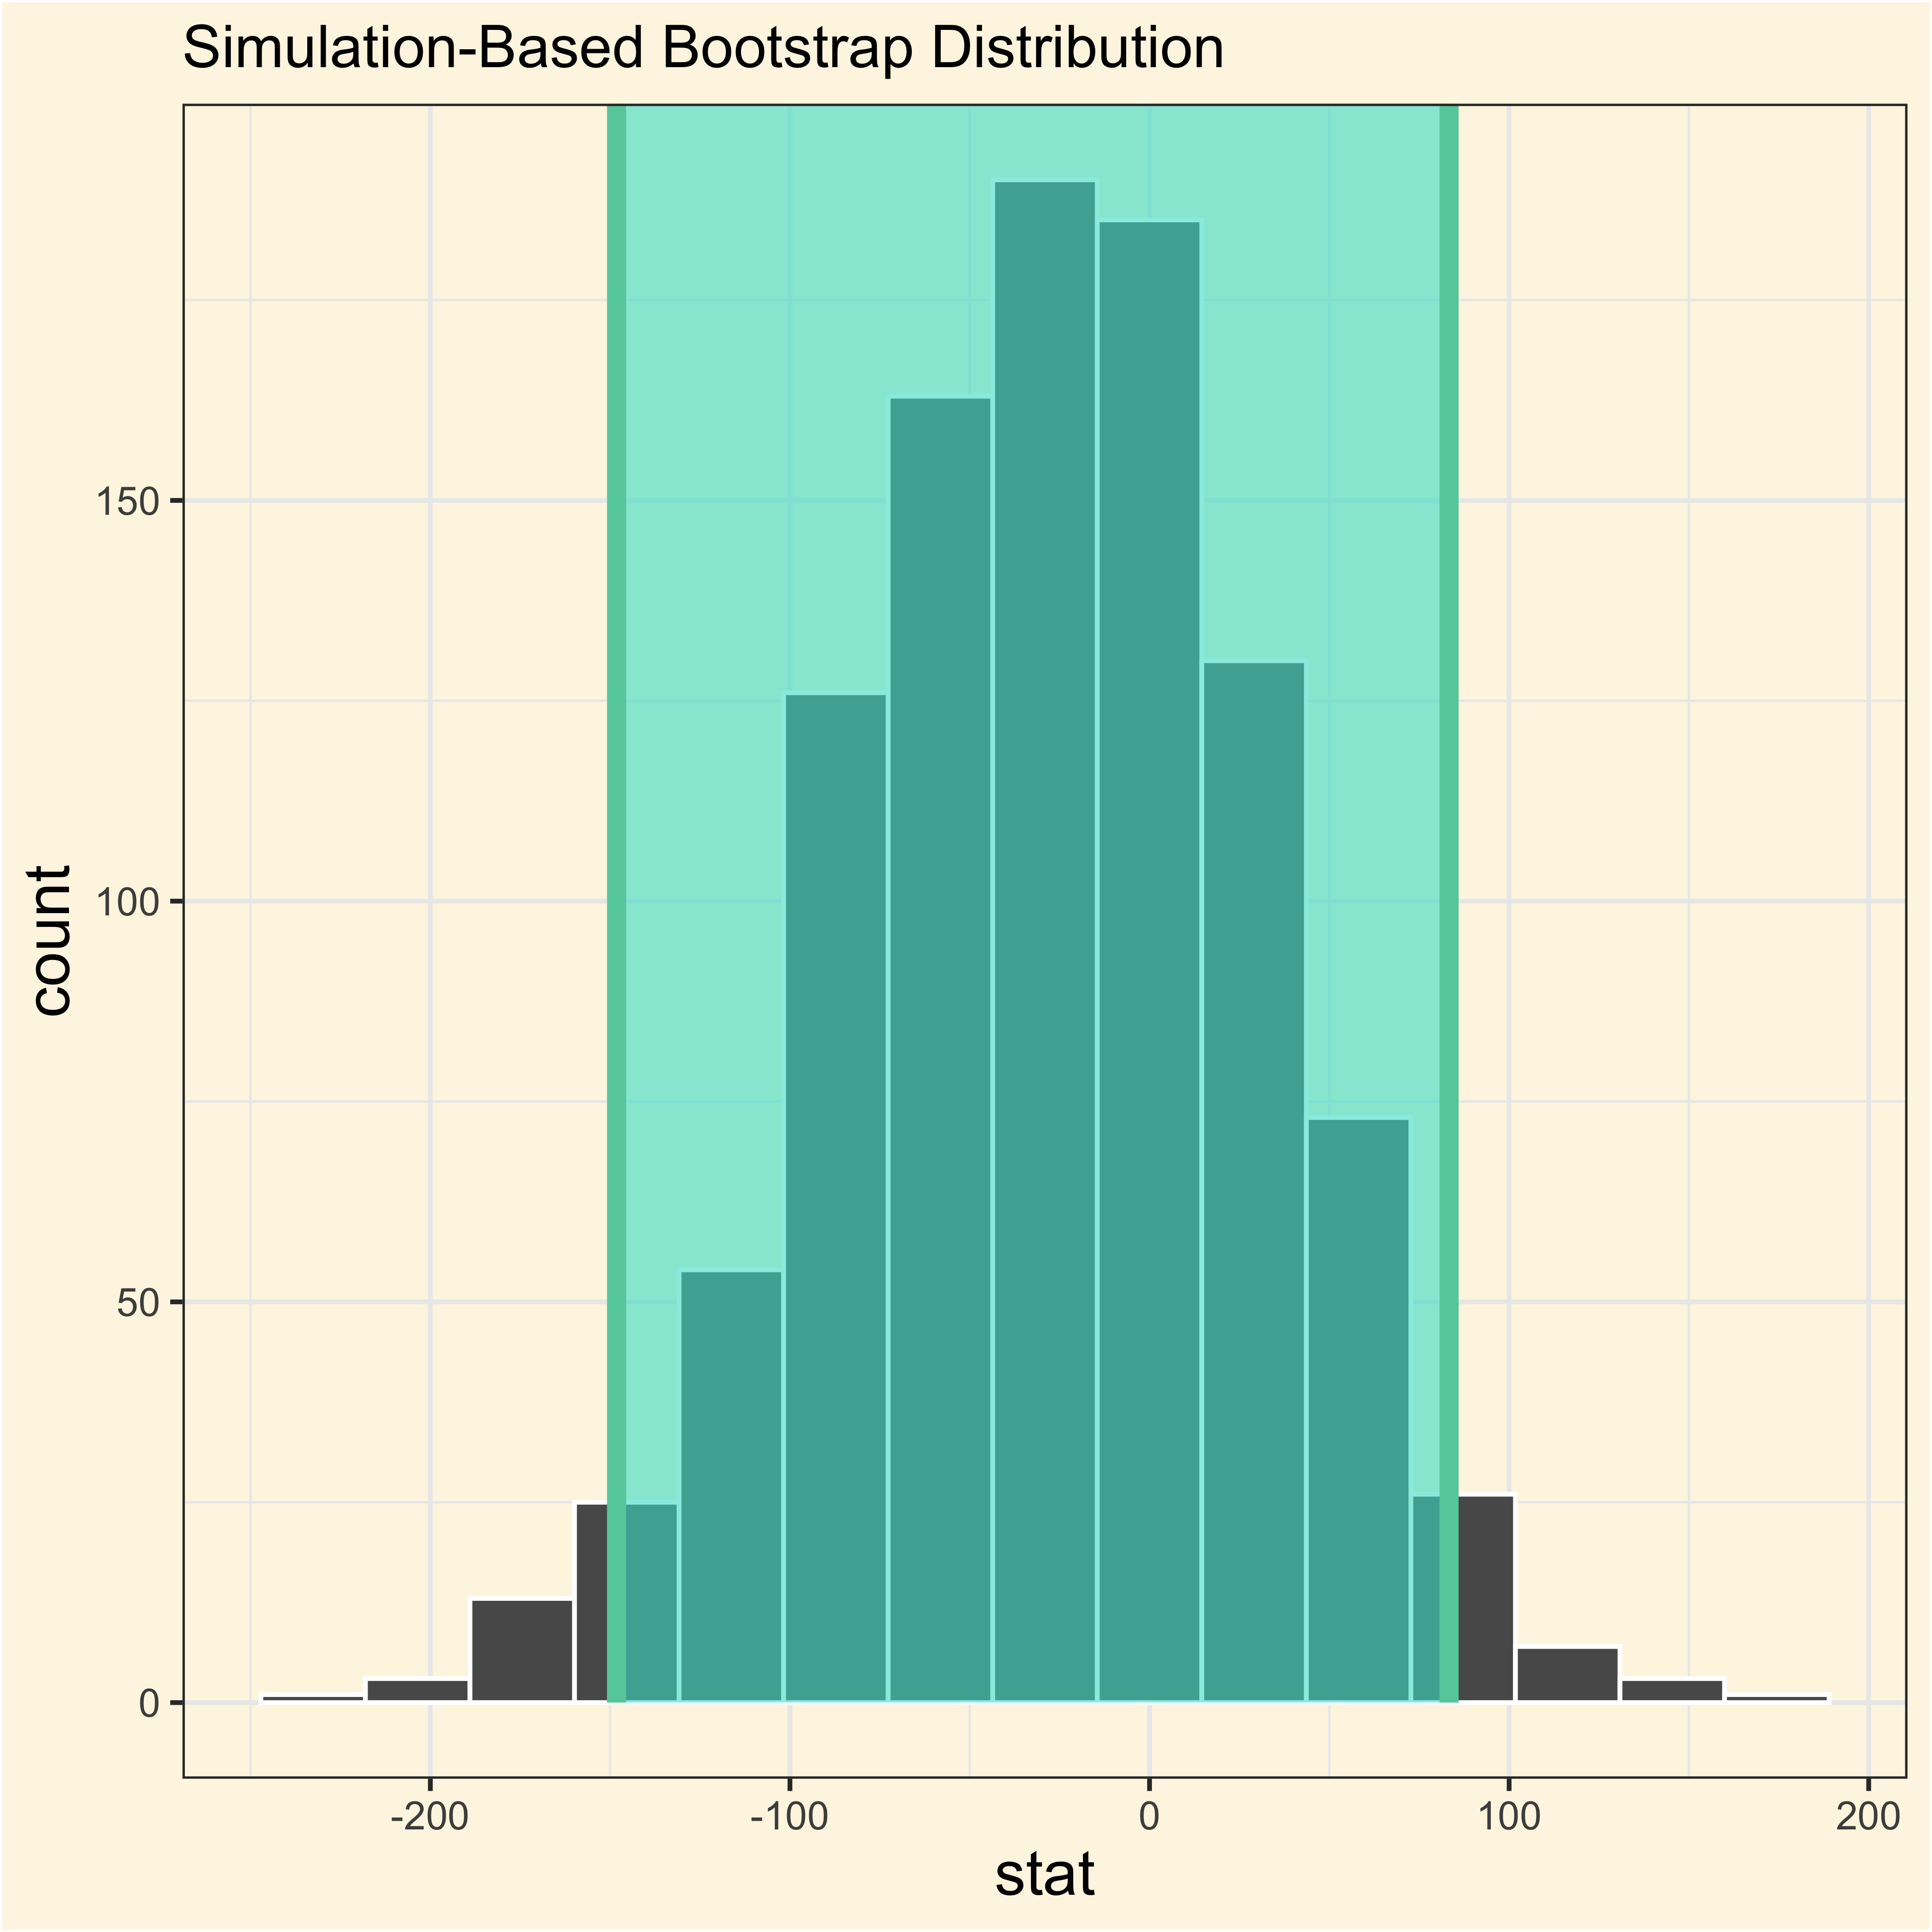
Adelie and Gentoo
Code
adelie_gentoo_bootstrap |>
  visualize() +
  shade_confidence_interval(endpoints = ag_ci)