ANOVA

https://bit.ly/41mzUK9

When do we apply ANOVA

When comparing a continuous variable across two or more groups. The question it tries to solve is: “is there a group different from the others?”

Establishing the hypothesis

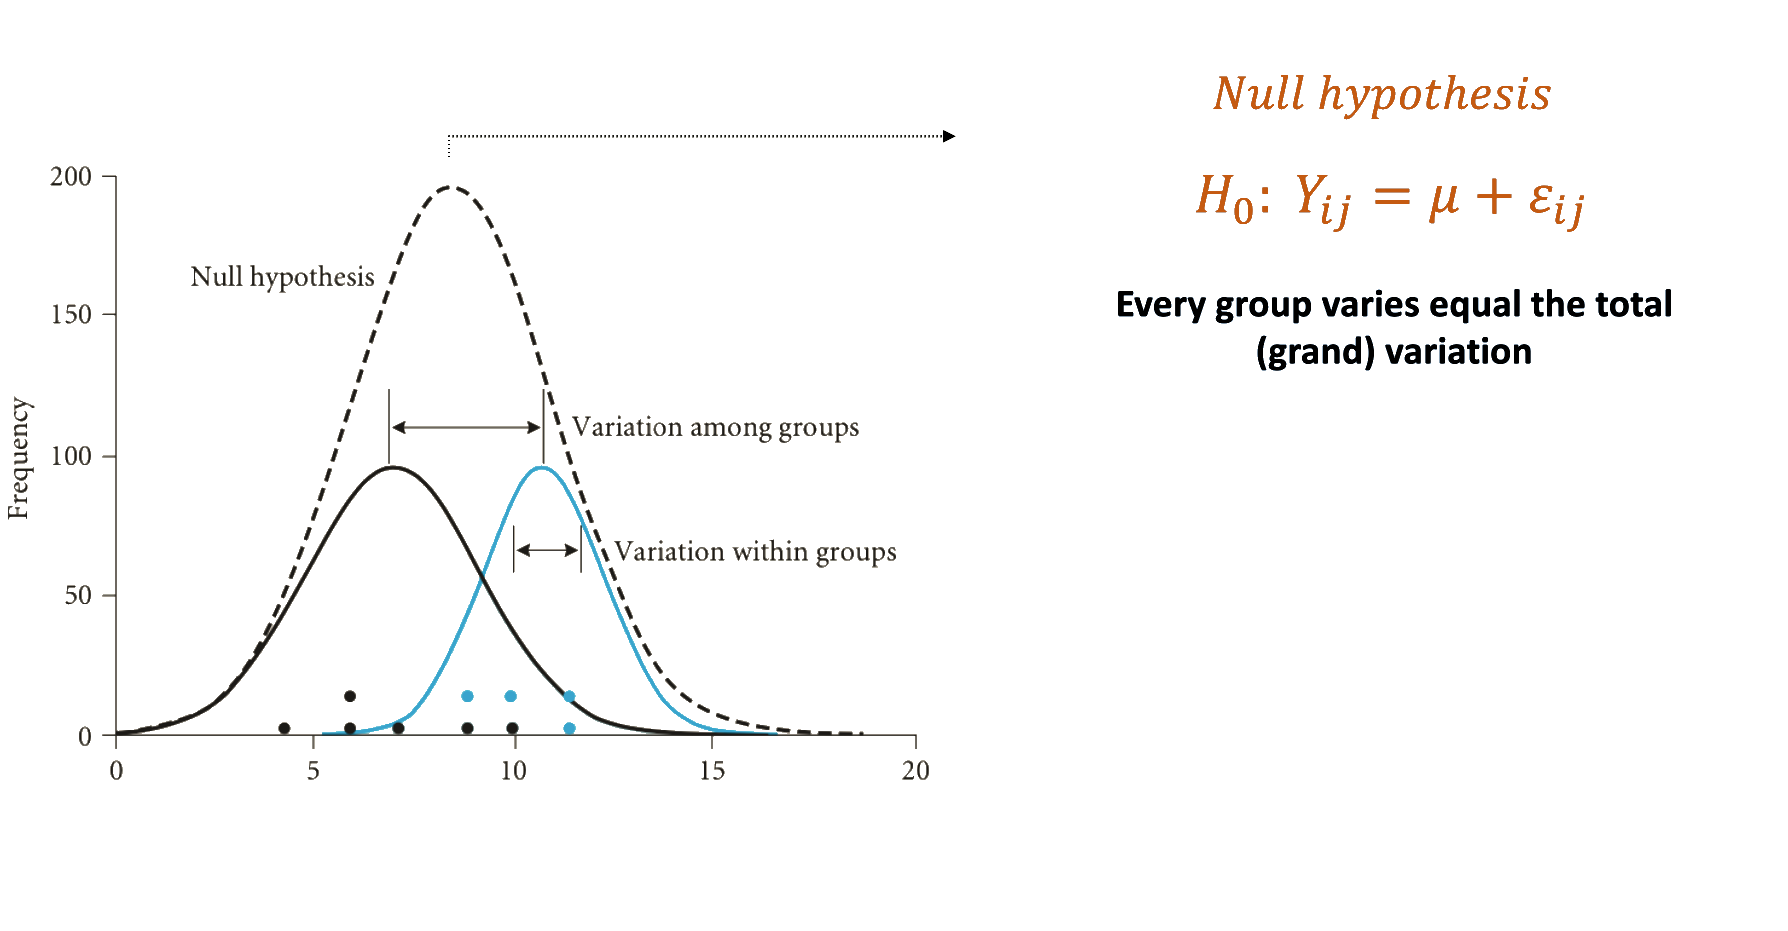
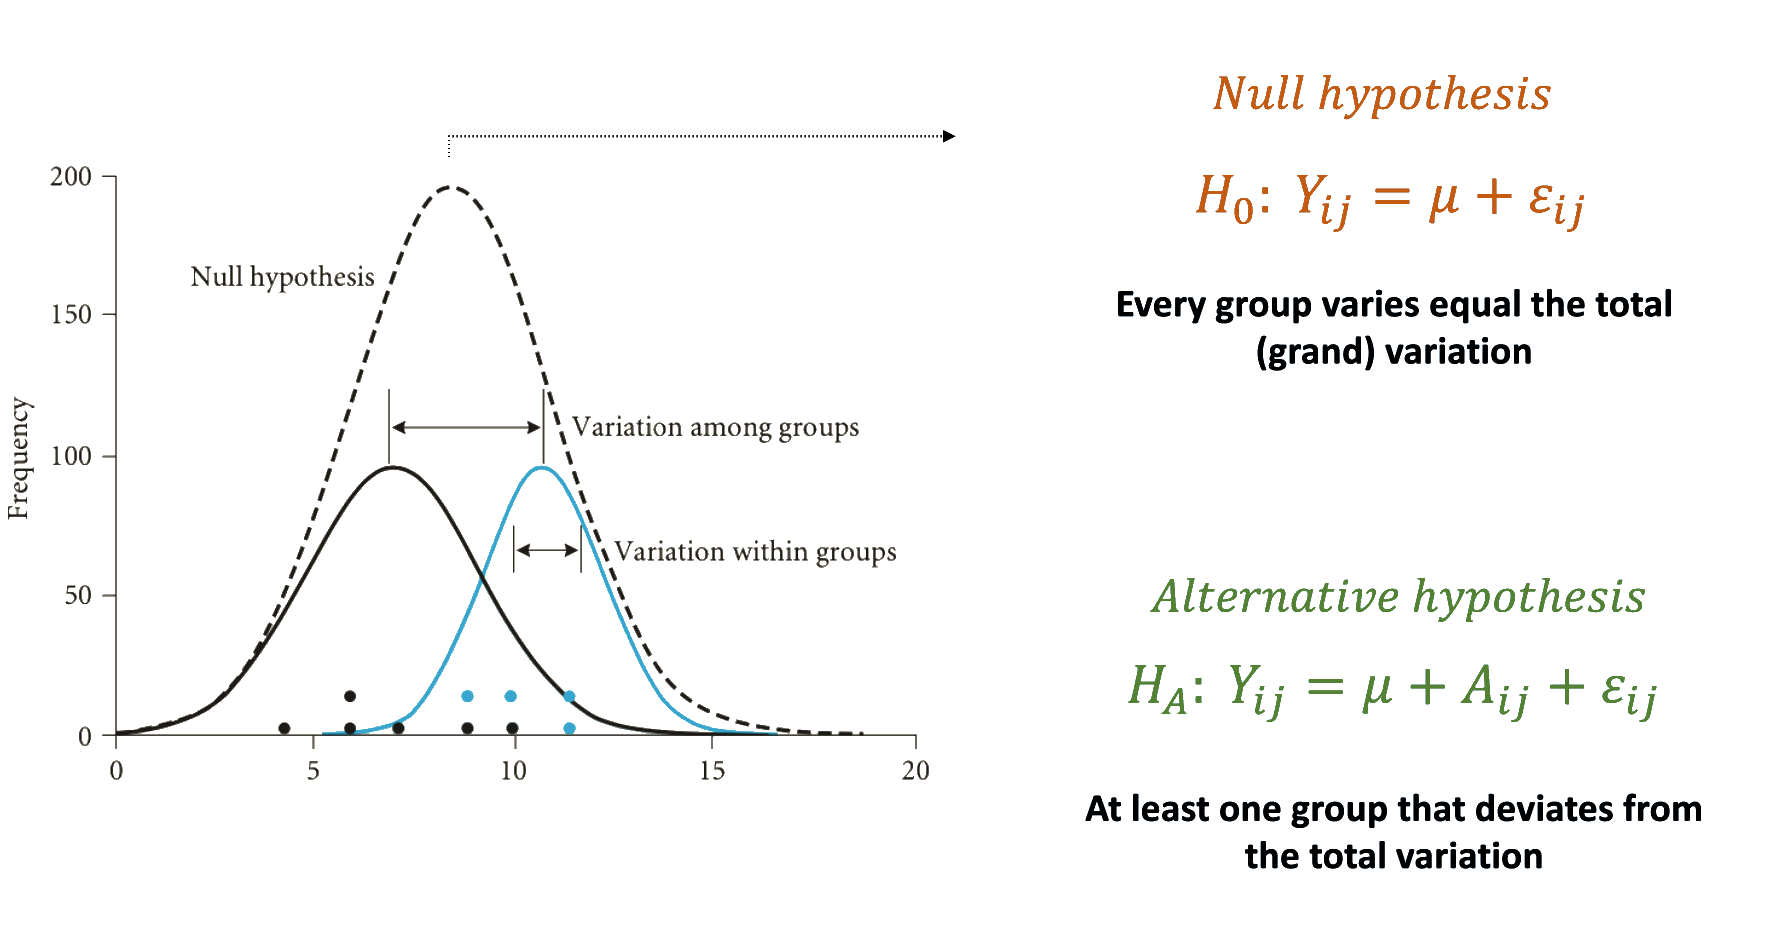
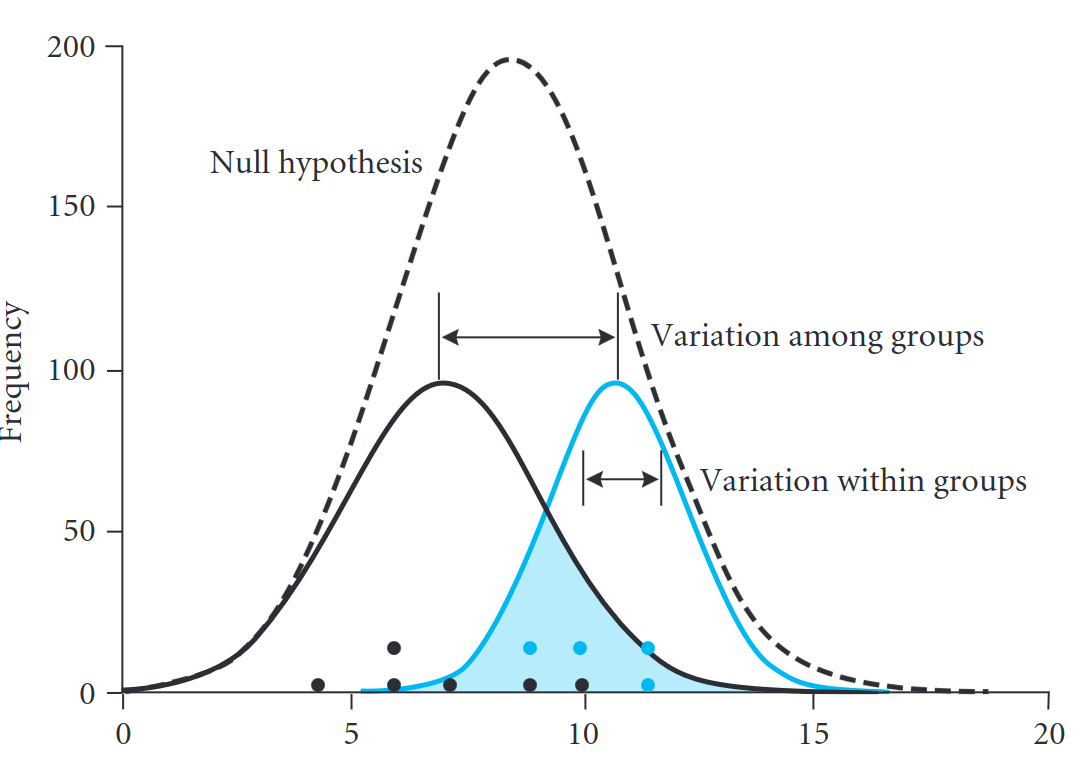
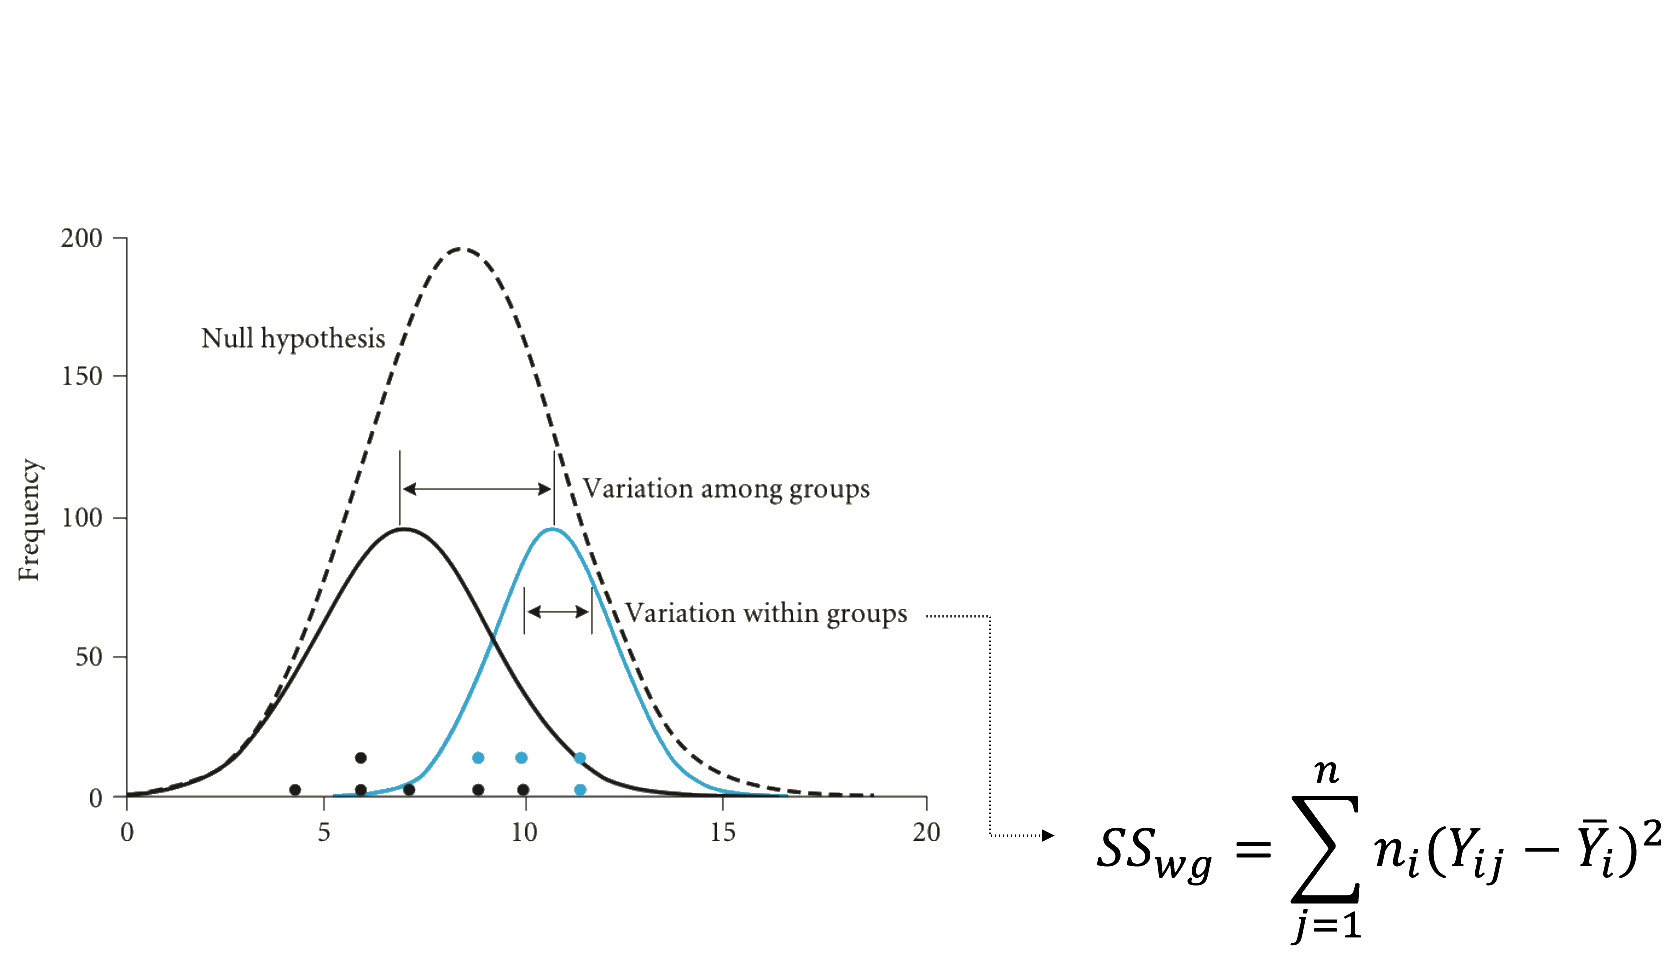
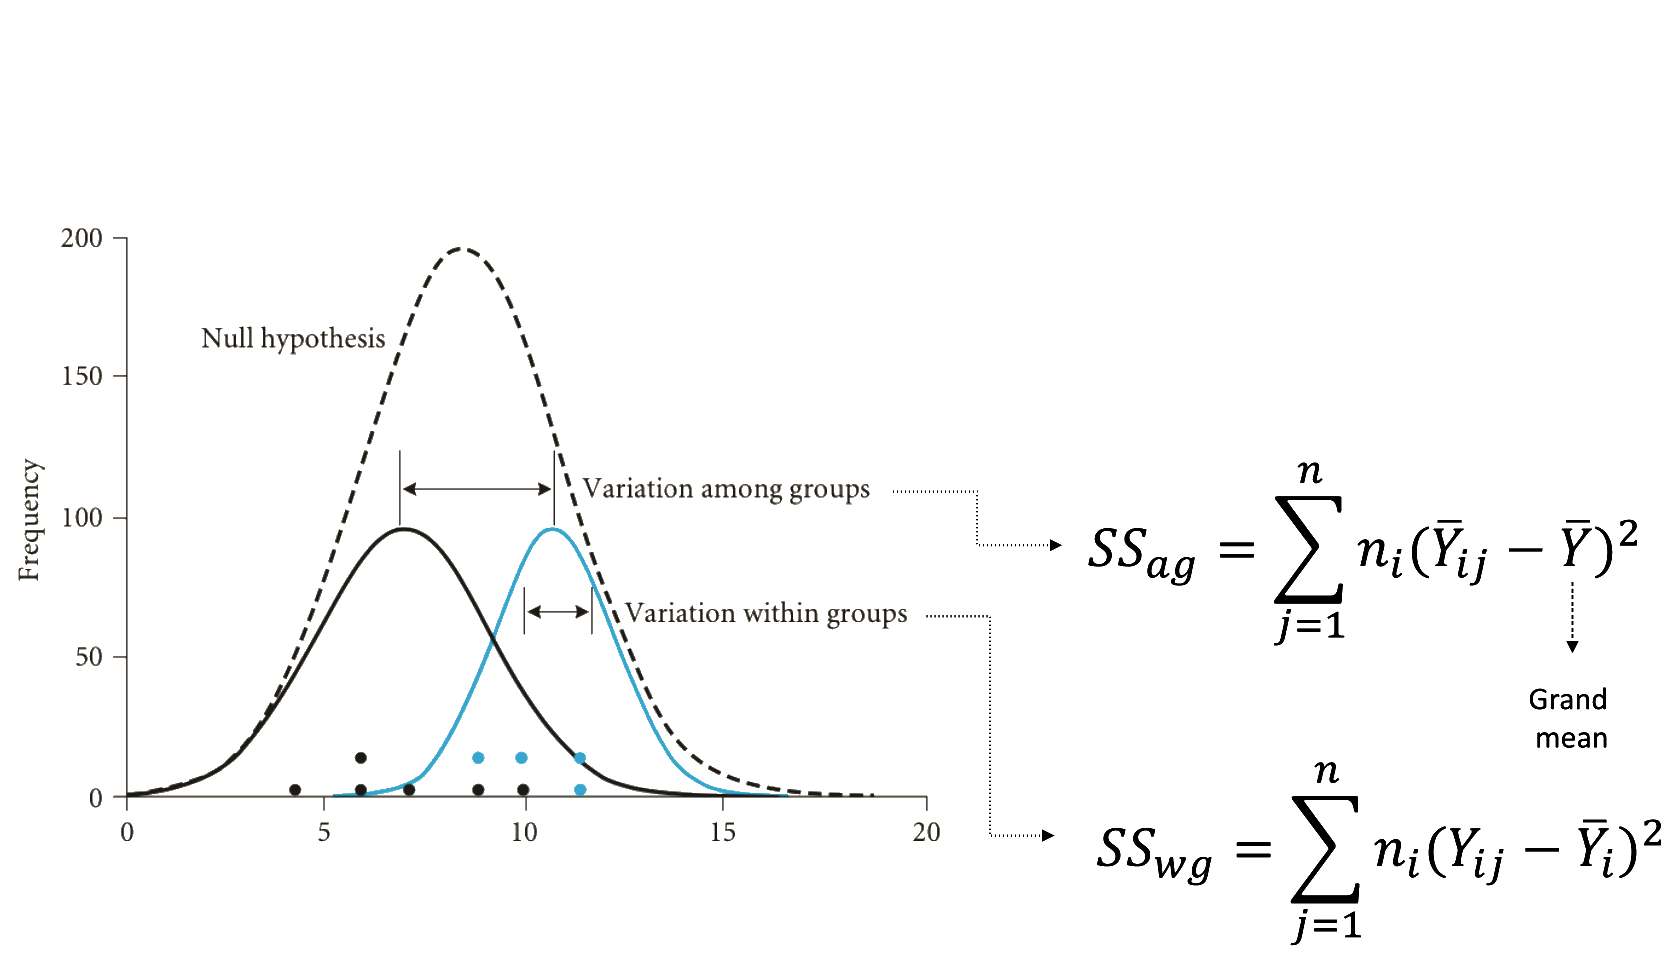
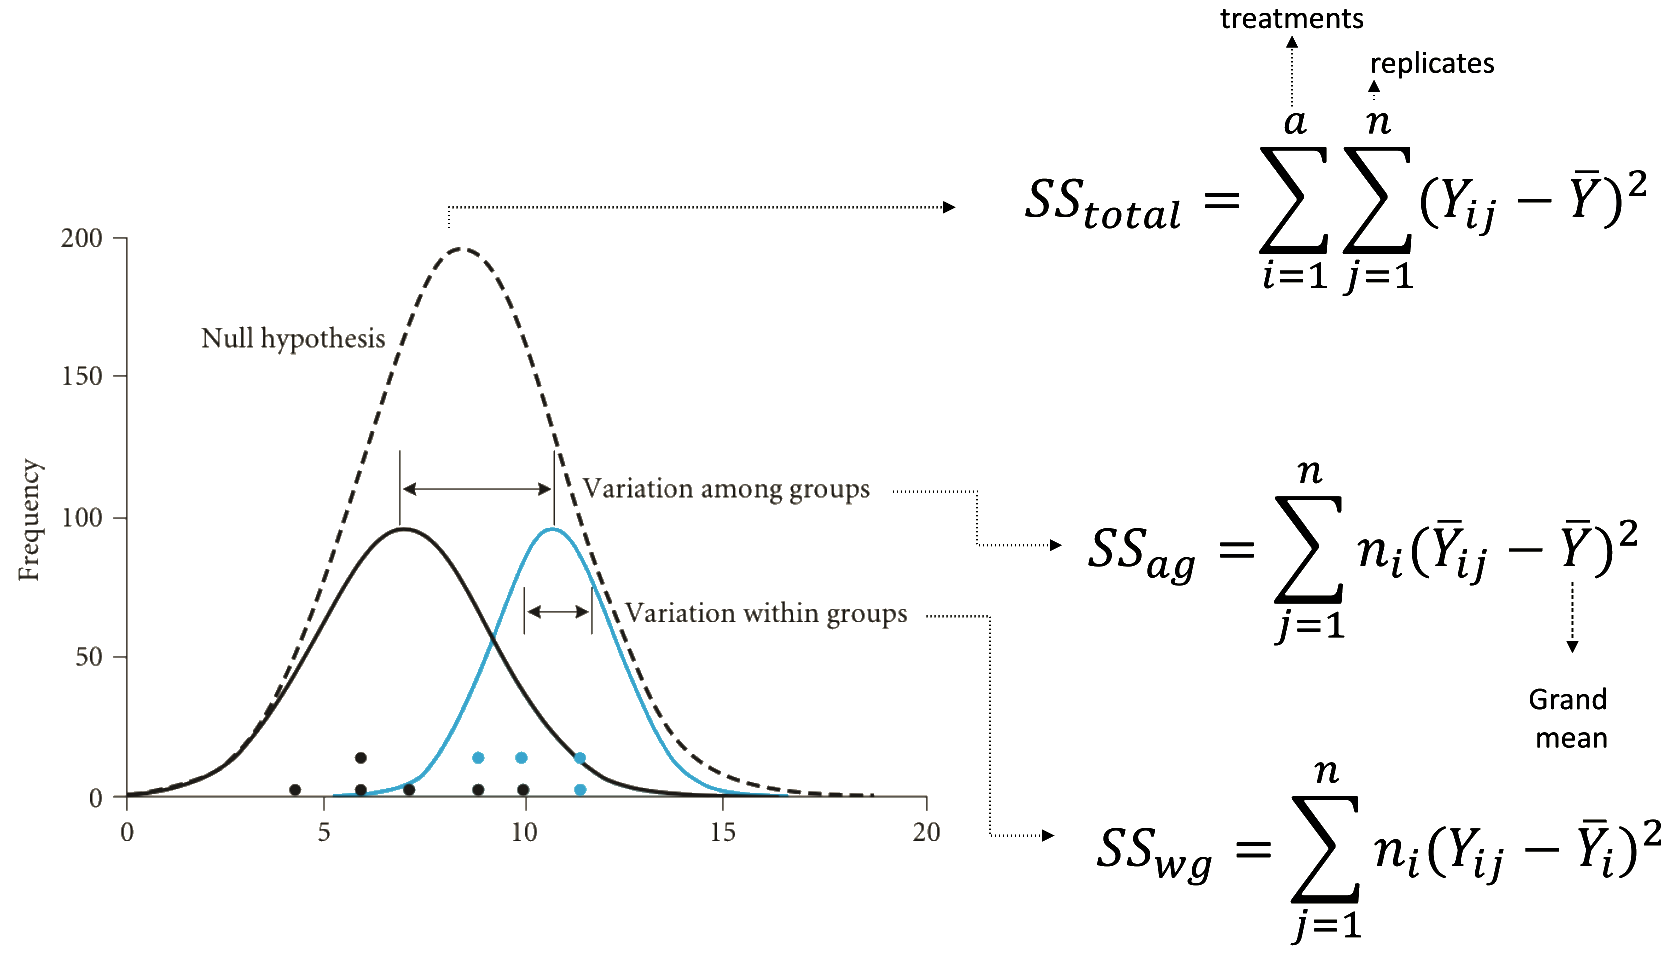
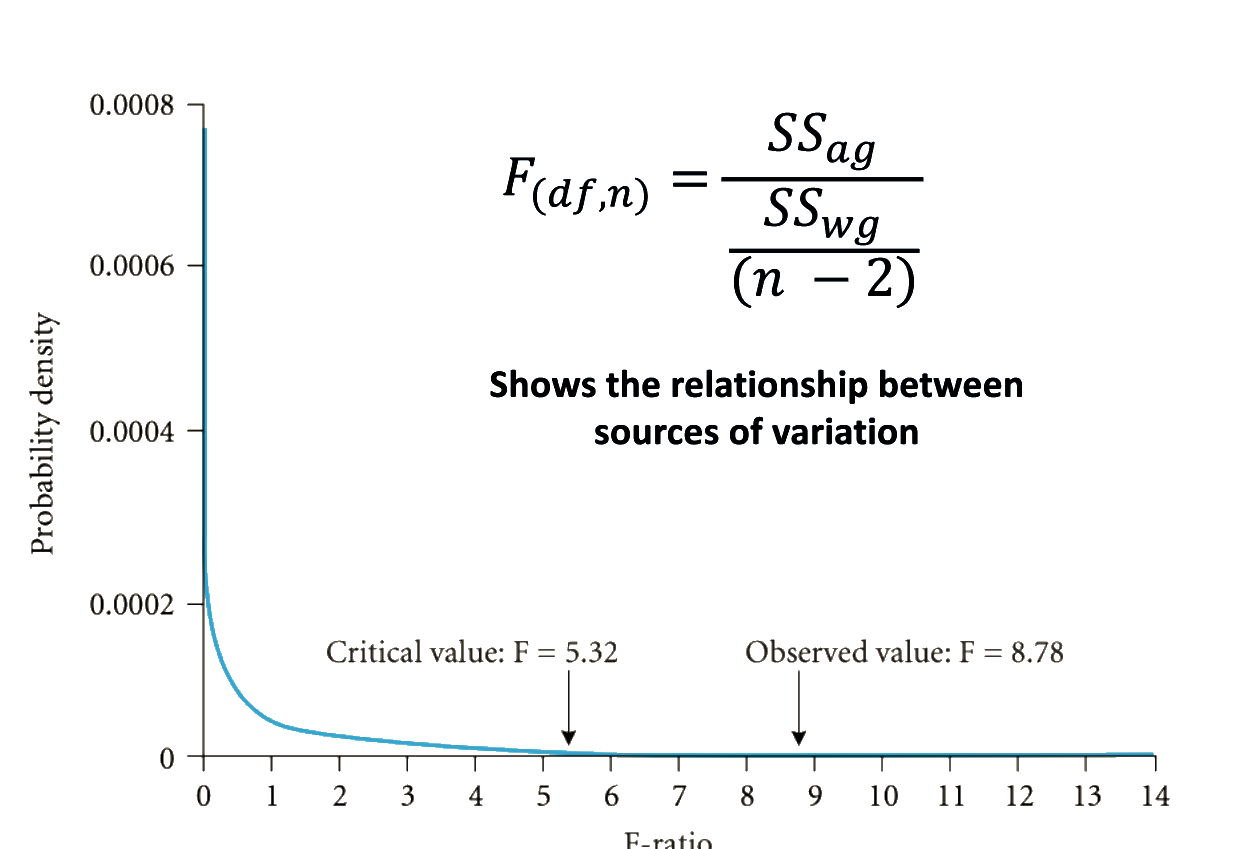
Understanding the fisher distribution
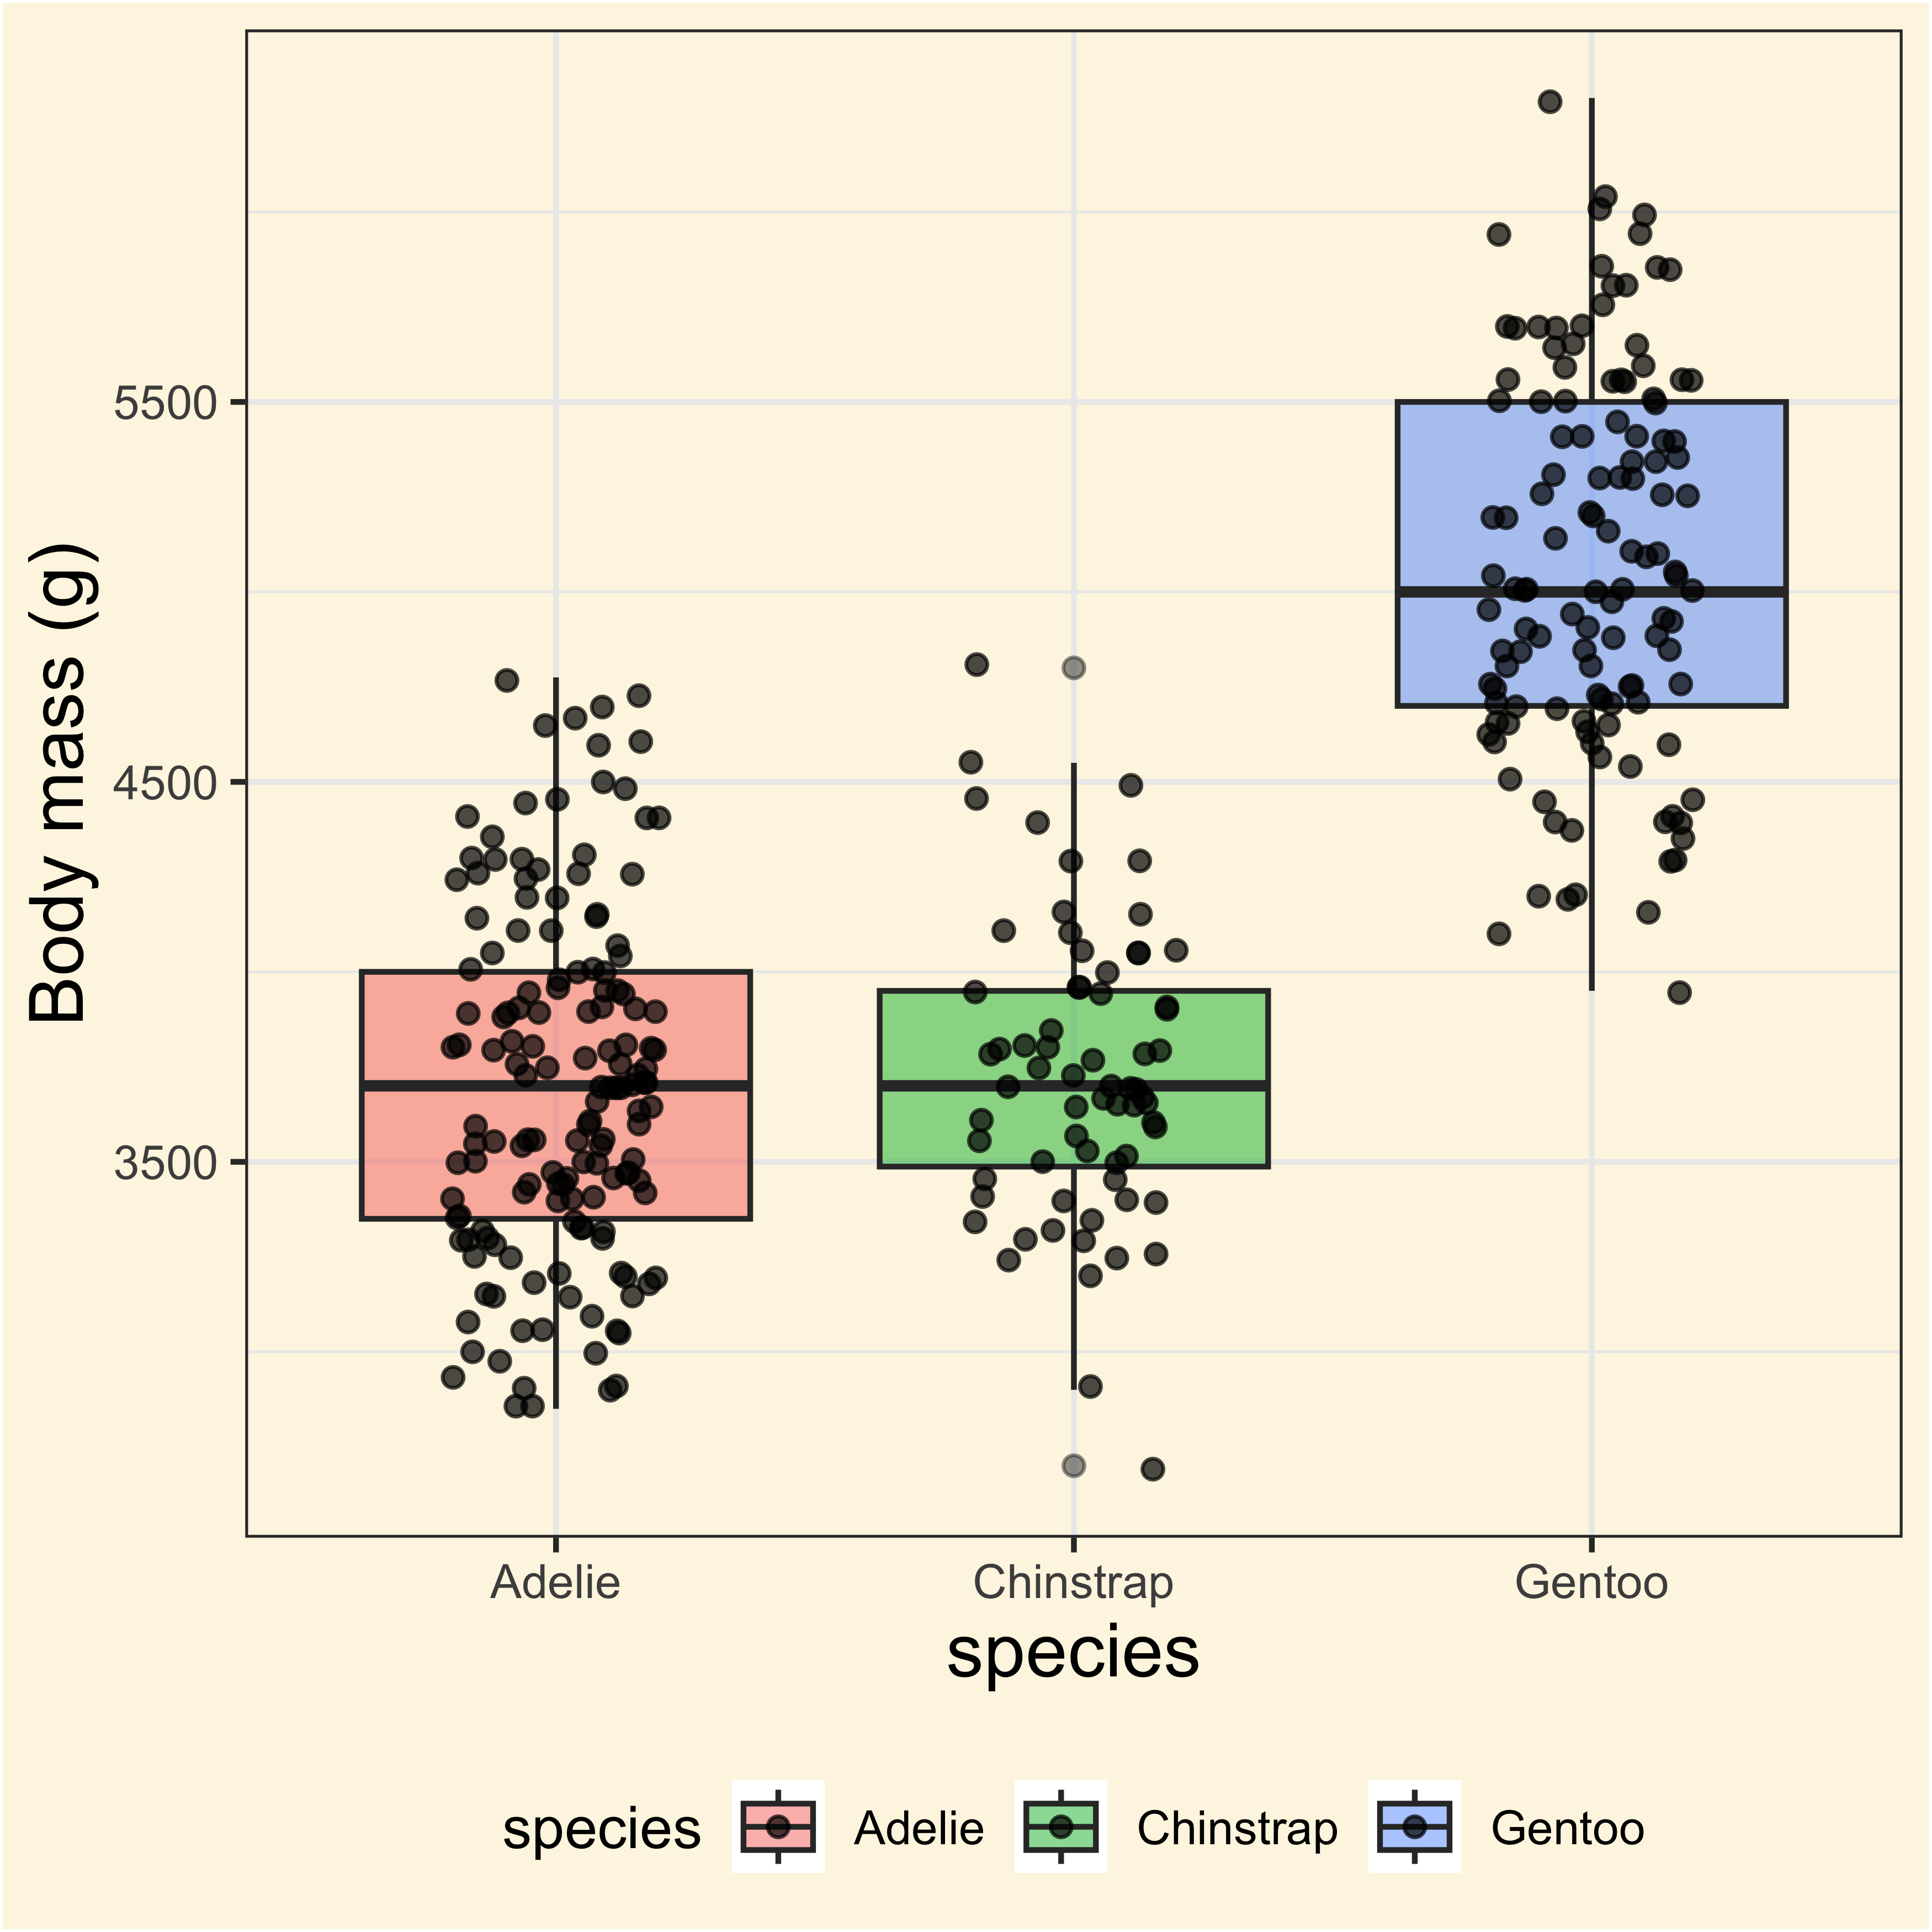
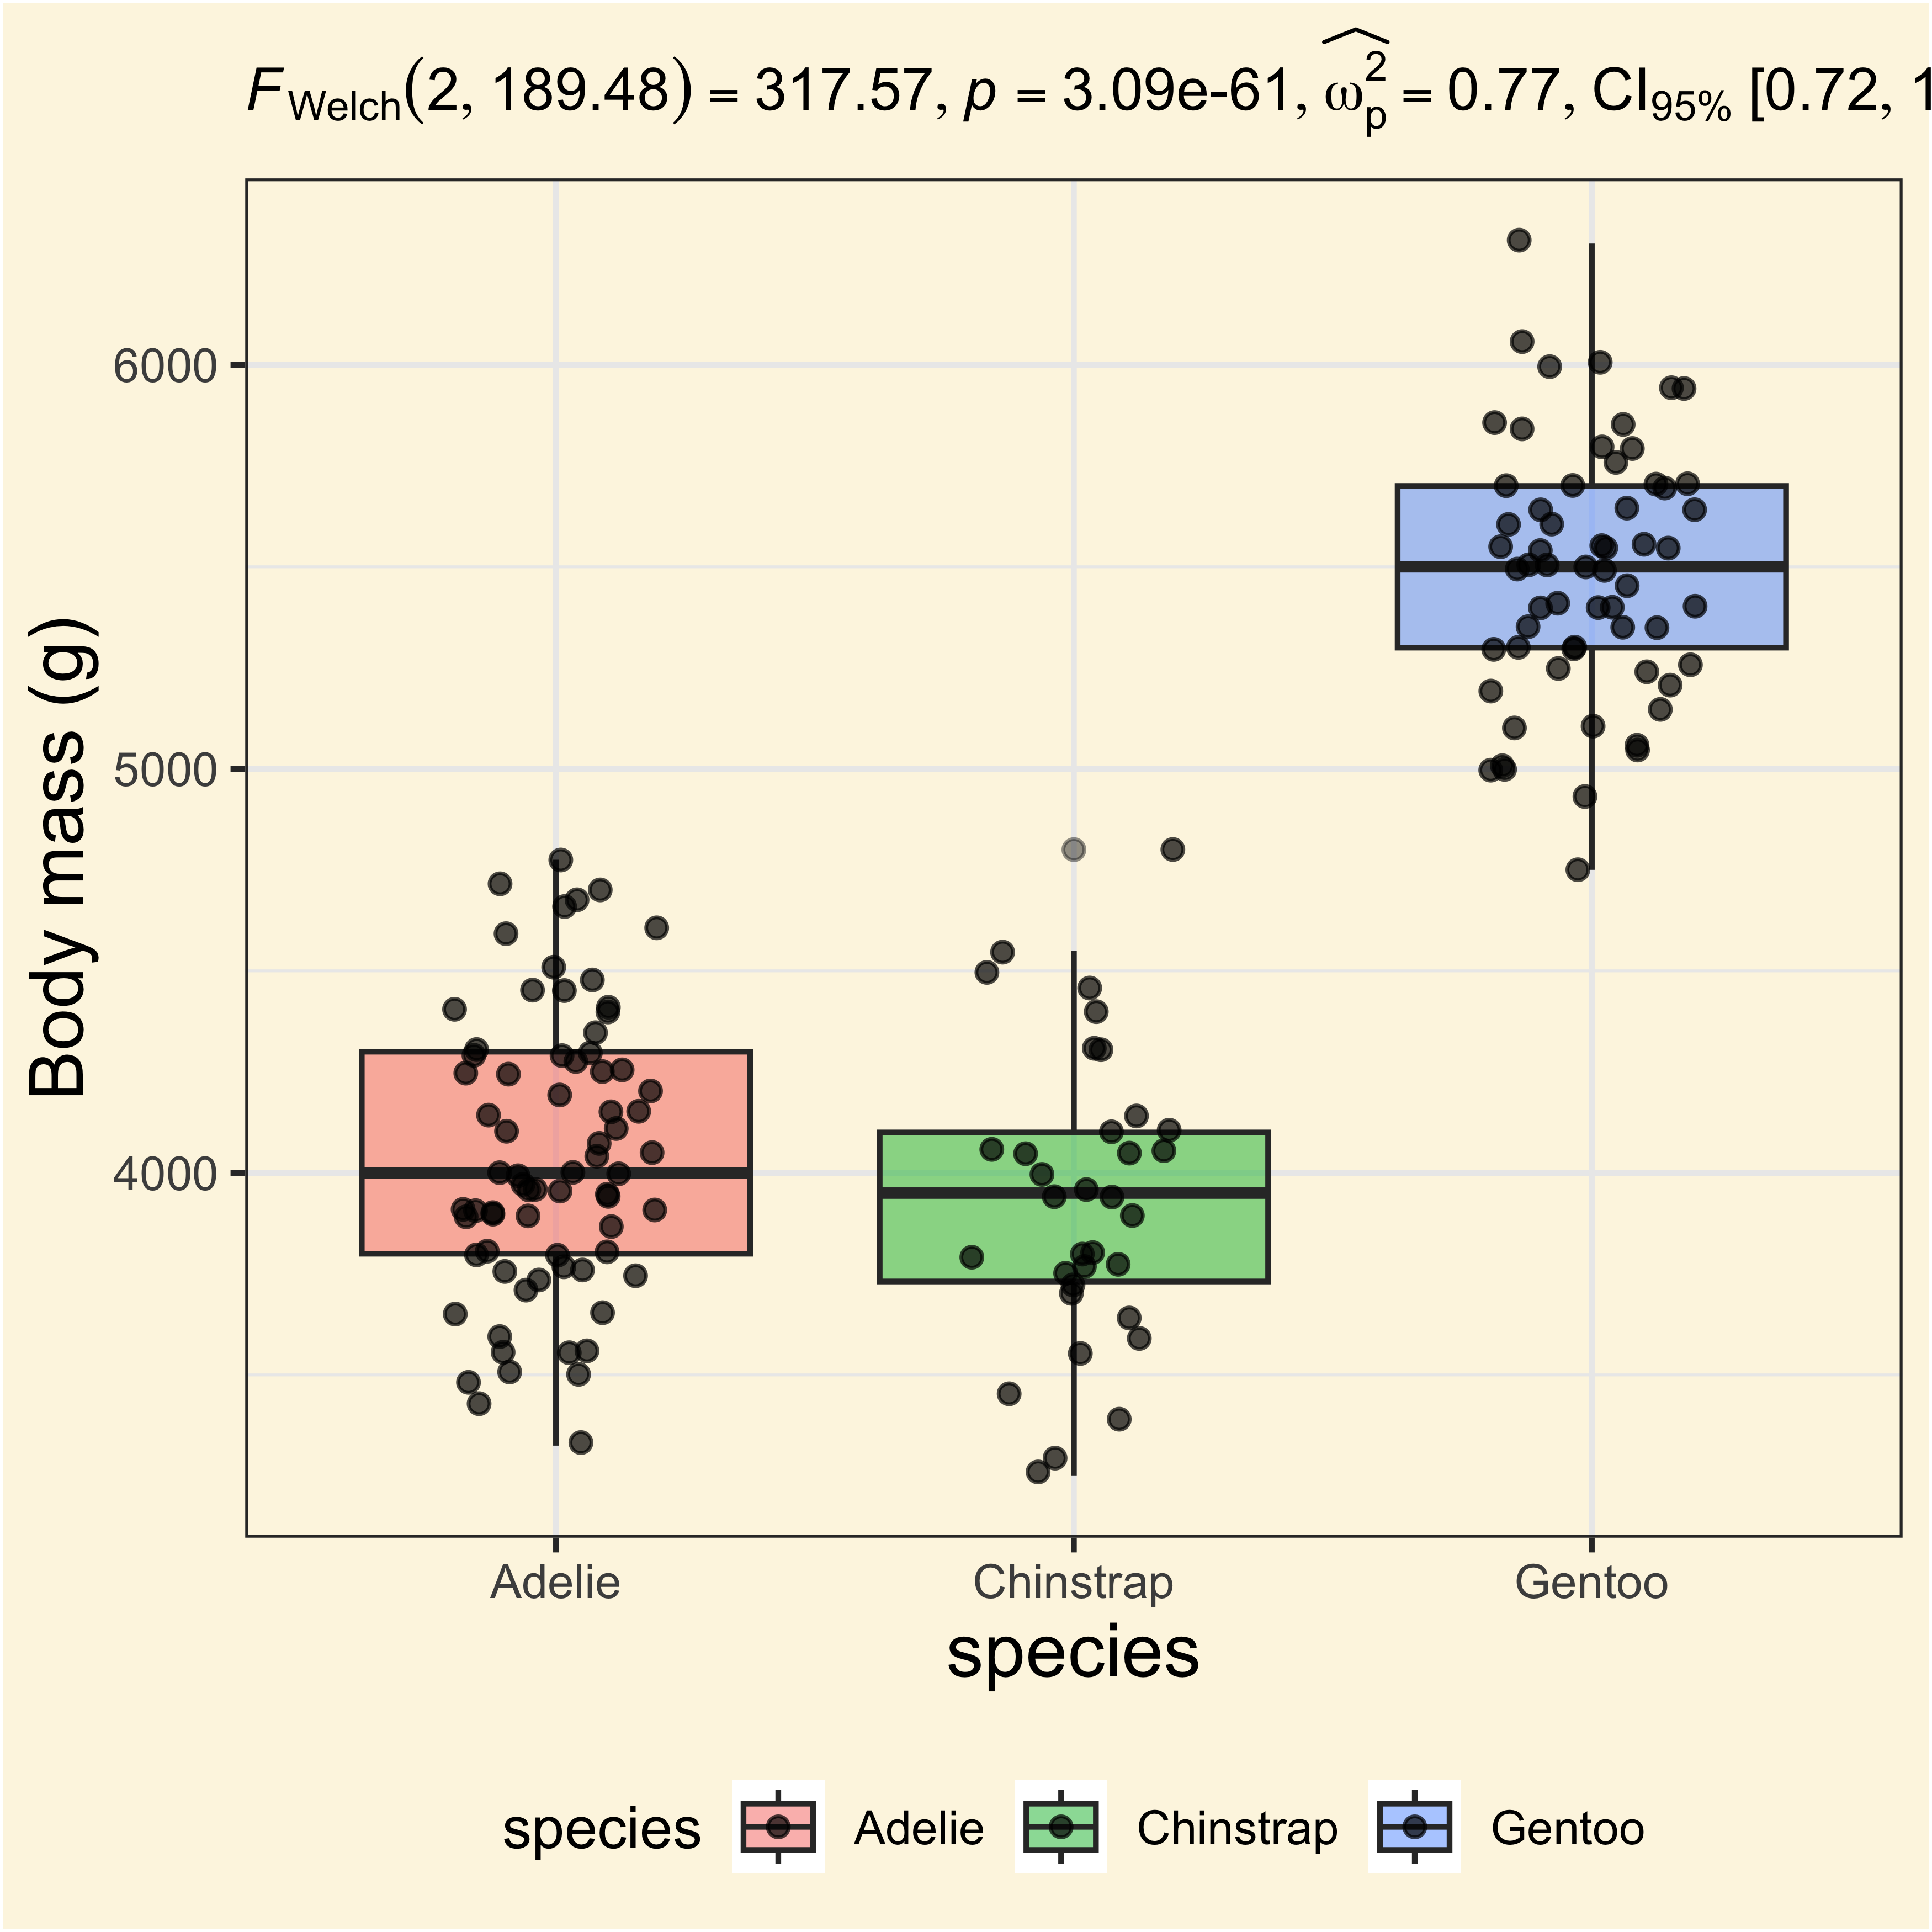
ANOVA assumptions

  1. Samples are independent (randomly sampled)
  2. Variance is homogenous/constant
  3. Residuals are normally distributed

Let’s try with an example

Applying ANOVA with different approaches

1. Using aov() function:

anovamodel <- aov(data = males, body_mass_g ~ species)

1. Using aov() function:

anovamodel <- aov(data = males, body_mass_g ~ species)
summary(anovamodel)
             Df   Sum Sq  Mean Sq F value Pr(>F)    
species       2 84728125 42364062   370.4 <2e-16 ***
Residuals   165 18871872   114375                   
---
Signif. codes:  0 '***' 0.001 '**' 0.01 '*' 0.05 '.' 0.1 ' ' 1

The Tukey-Krammer test to make pairwise comparisons:

TukeyHSD(anovamodel)
  Tukey multiple comparisons of means
    95% family-wise confidence level

Fit: aov(formula = body_mass_g ~ species, data = males)

$species
                      diff       lwr        upr     p adj
Chinstrap-Adelie -104.5226 -270.5952   61.55003 0.2990486
Gentoo-Adelie    1441.3429 1302.5929 1580.09292 0.0000000
Gentoo-Chinstrap 1545.8655 1374.6810 1717.04996 0.0000000

2. Using the statsExpression package:

anovatbl <- oneway_anova(data = penguins, x = species, y = body_mass_g)
anovatbl

Adding stats to the plots!

ggplot(males, 
  aes(
    x = species, 
    y = body_mass_g, 
    fill = species
    )) +
  geom_boxplot(alpha = 0.5) +
  geom_jitter(width = 0.2, alpha = 0.7) +
  labs(
    y = "Body mass (g)",
    subtitle = anovatbl$expression[[1]]
    )

But why there are not comparisons?

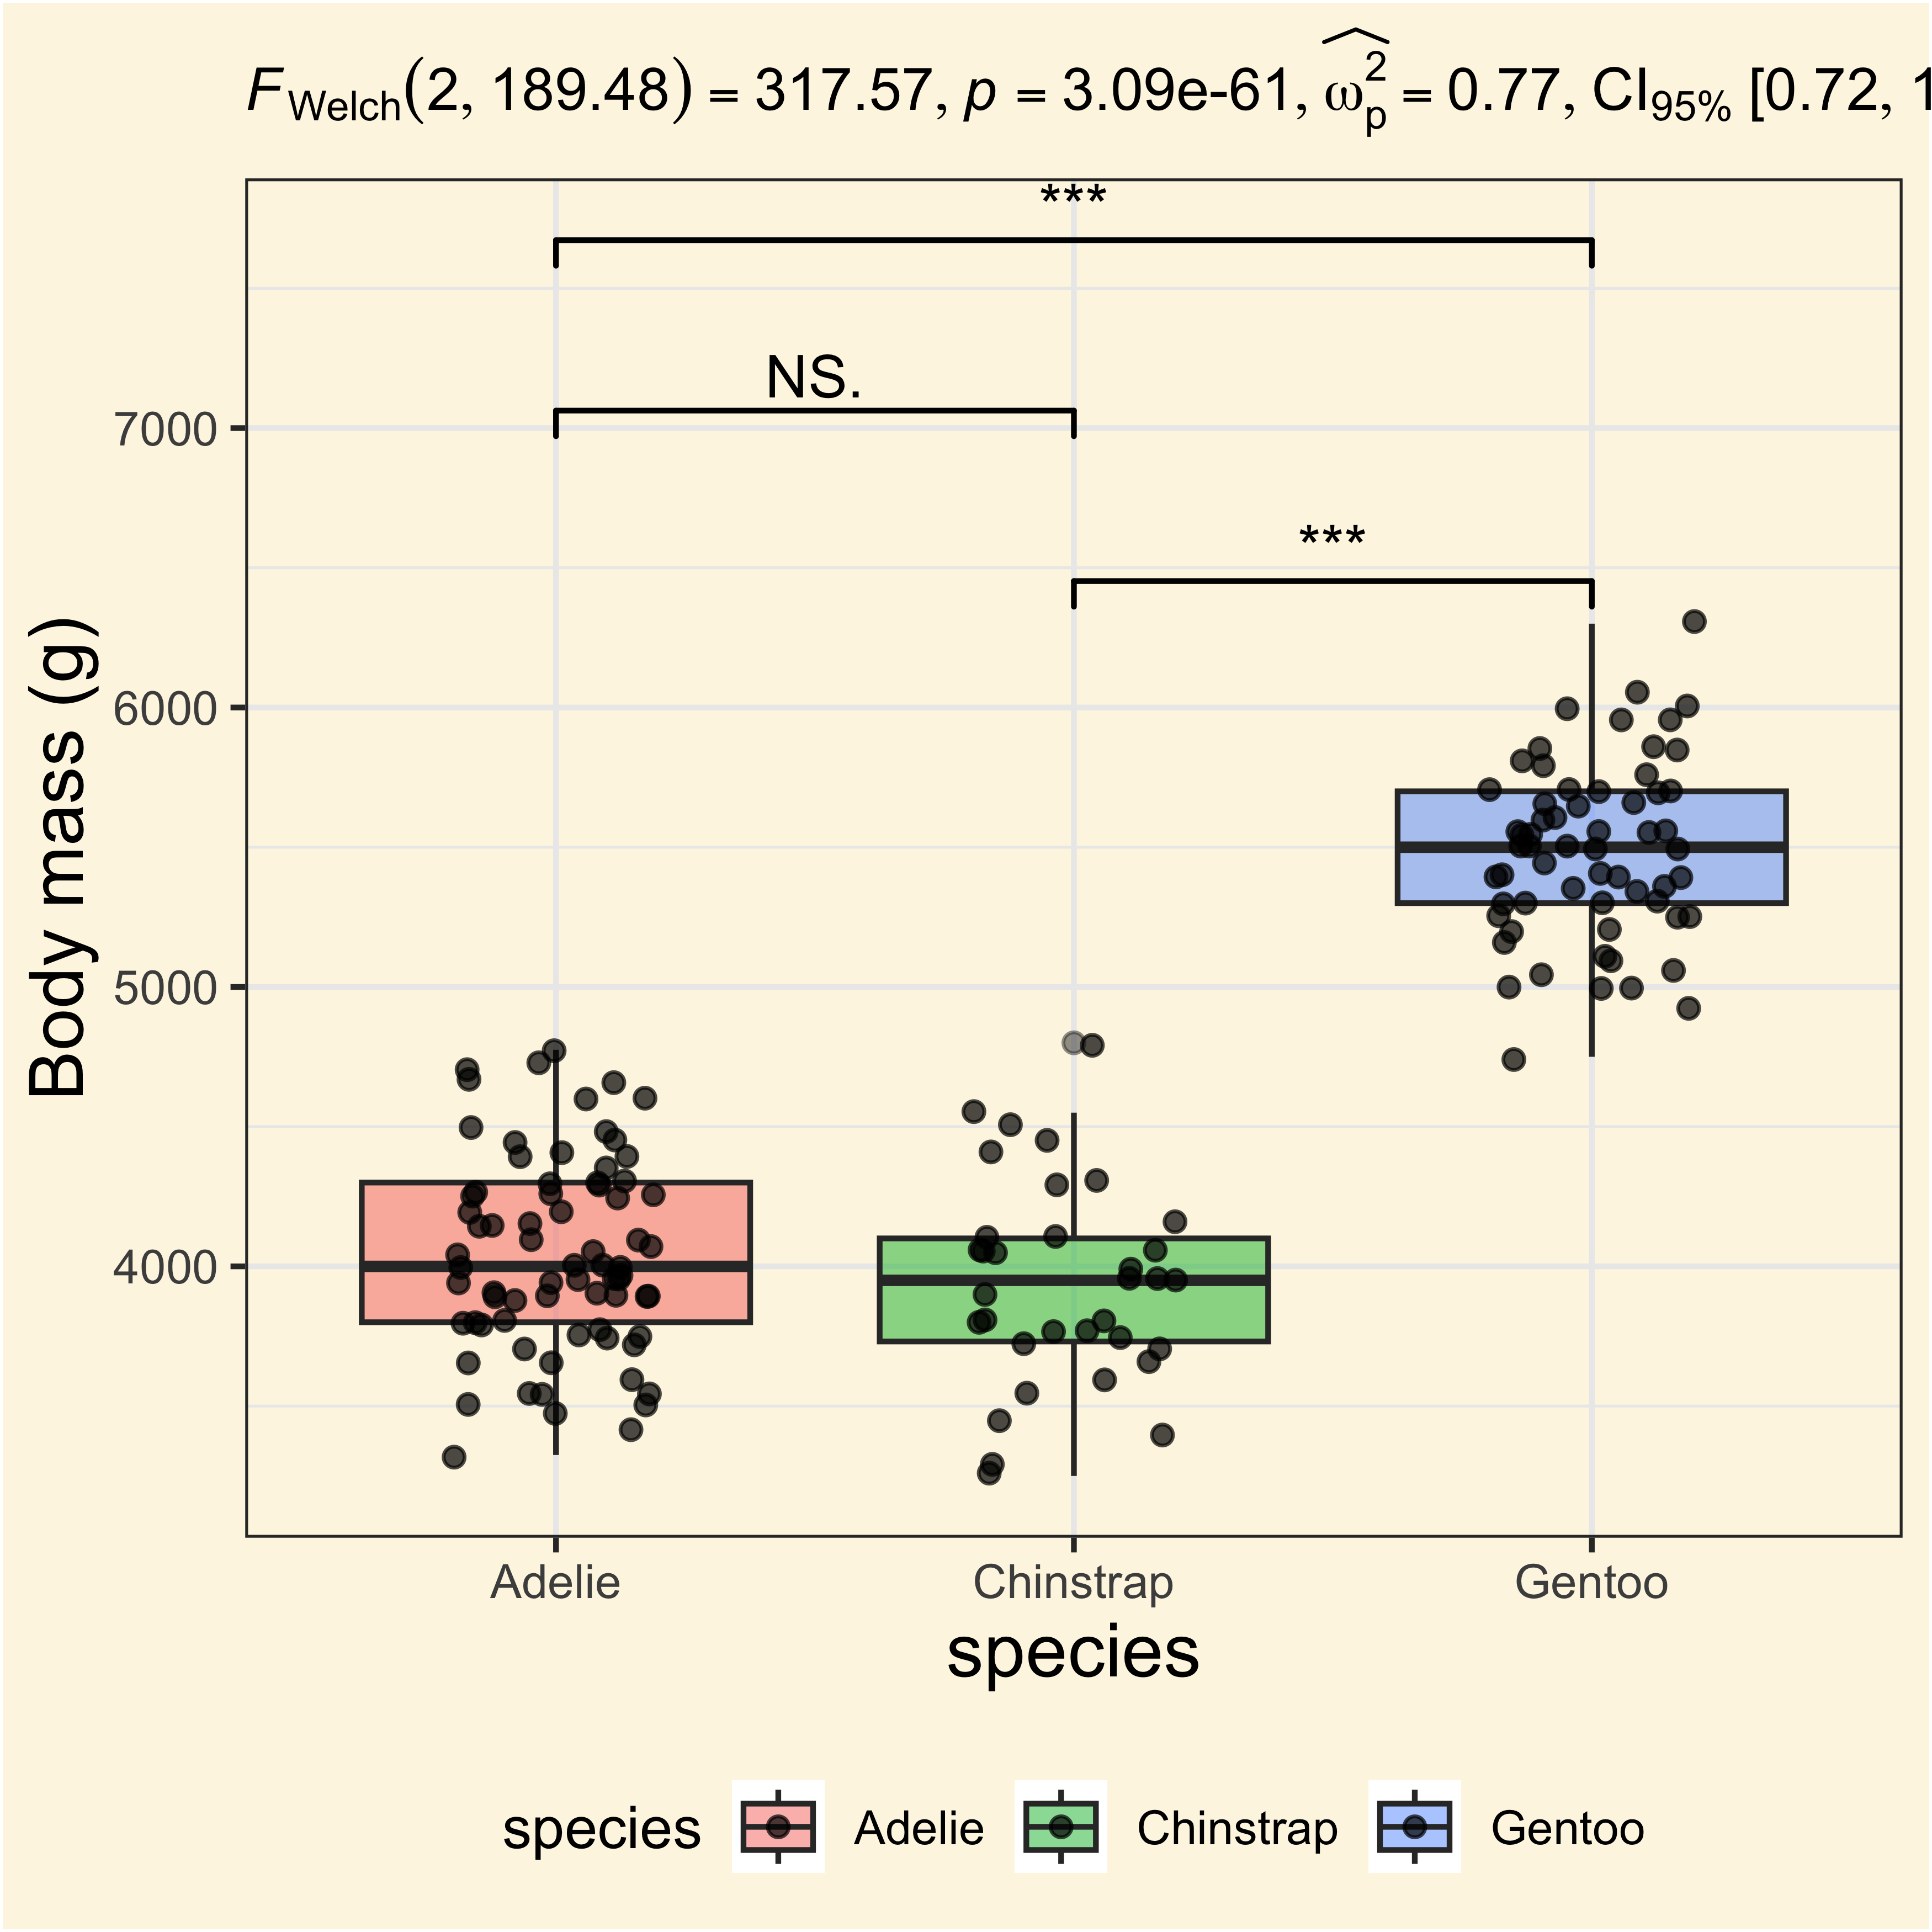
Adding pairwise comparisons

ggplot(males, 
  aes(
    x = species, 
    y = body_mass_g, 
    fill = species
    )) +
  geom_boxplot(alpha = 0.5) +
  geom_jitter(width = 0.2, alpha = 0.7) +
  labs(
    y = "Body mass (g)",
    subtitle = anovatbl$expression[[1]]
    ) +
  geom_signif(
    comparisons = list(
      c("Gentoo", "Chinstrap"),
      c("Adelie", "Chinstrap"),
      c("Adelie", "Gentoo")
    ),
    step_increase = 0.2,
    map_signif_level = TRUE
  )

Testing the ANOVA assumptions with performance

  1. Sample and residuals independence:
check_autocorrelation(anovamodel)
OK: Residuals appear to be independent and not autocorrelated (p = 0.082).
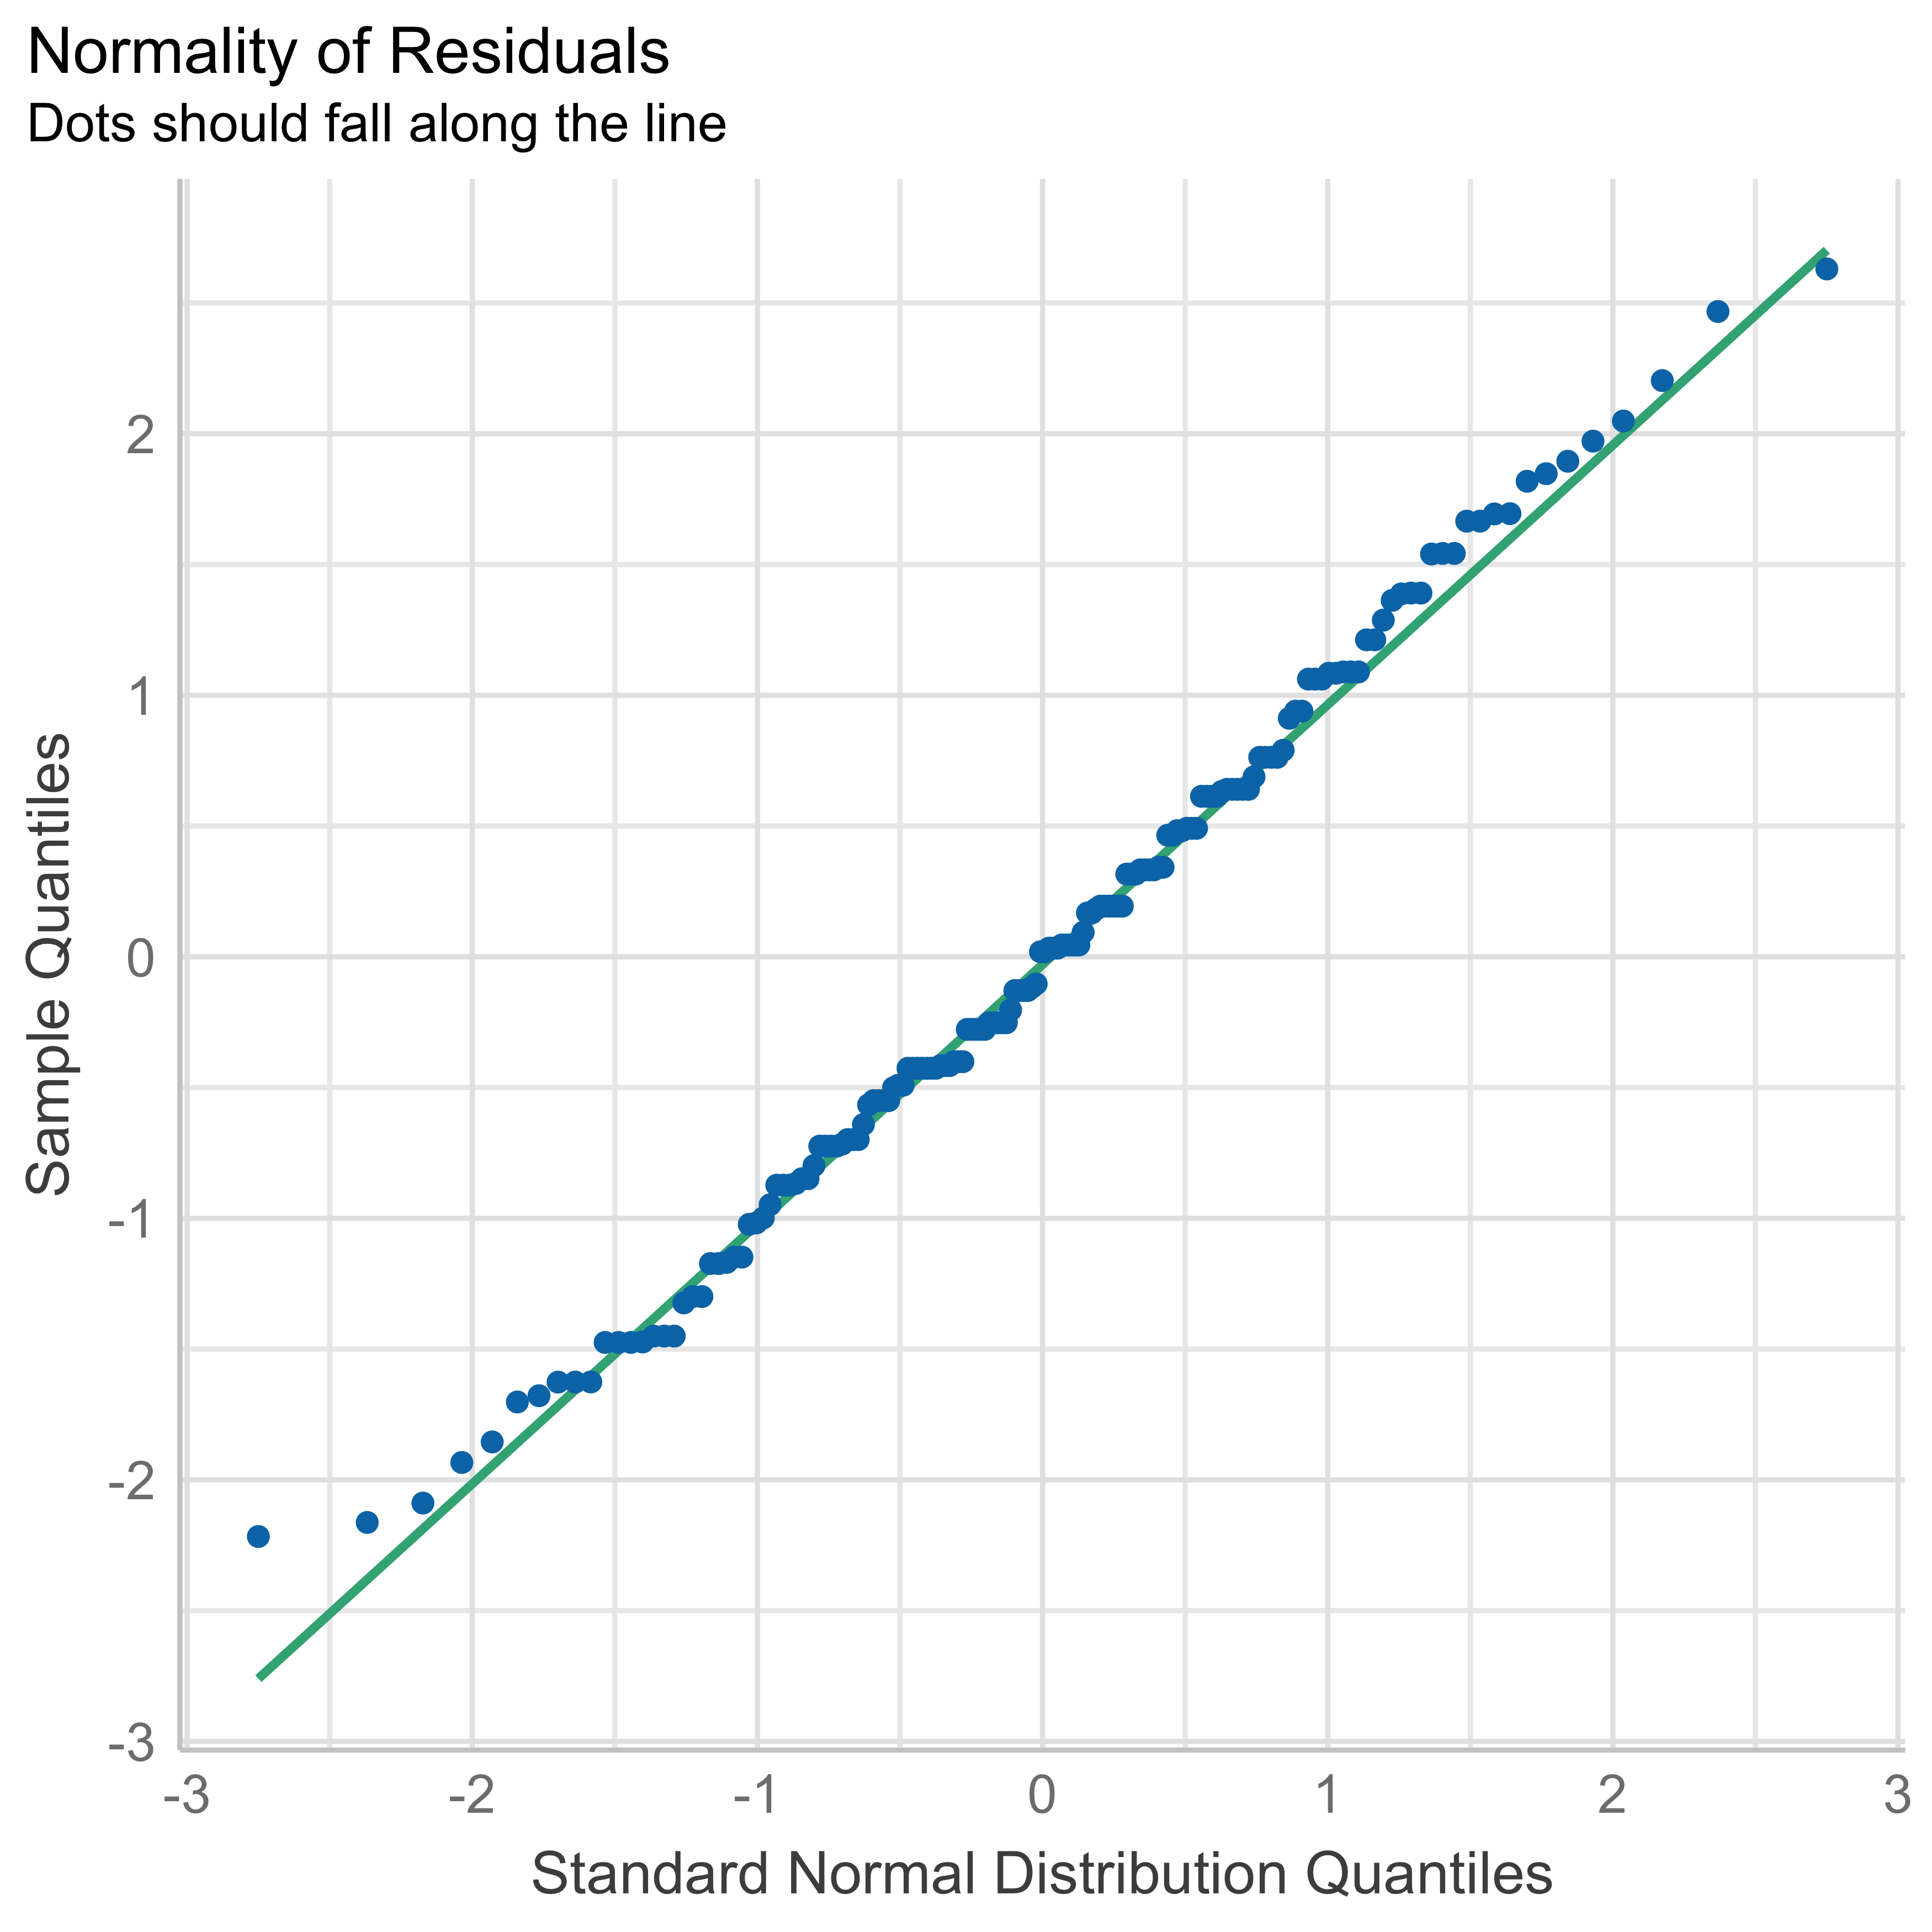
  1. Normality of the residuals:
check_normality(anovamodel)
OK: residuals appear as normally distributed (p = 0.484).
plot(check_normality(anovamodel))
plot(check_normality(anovamodel), type = "qq")

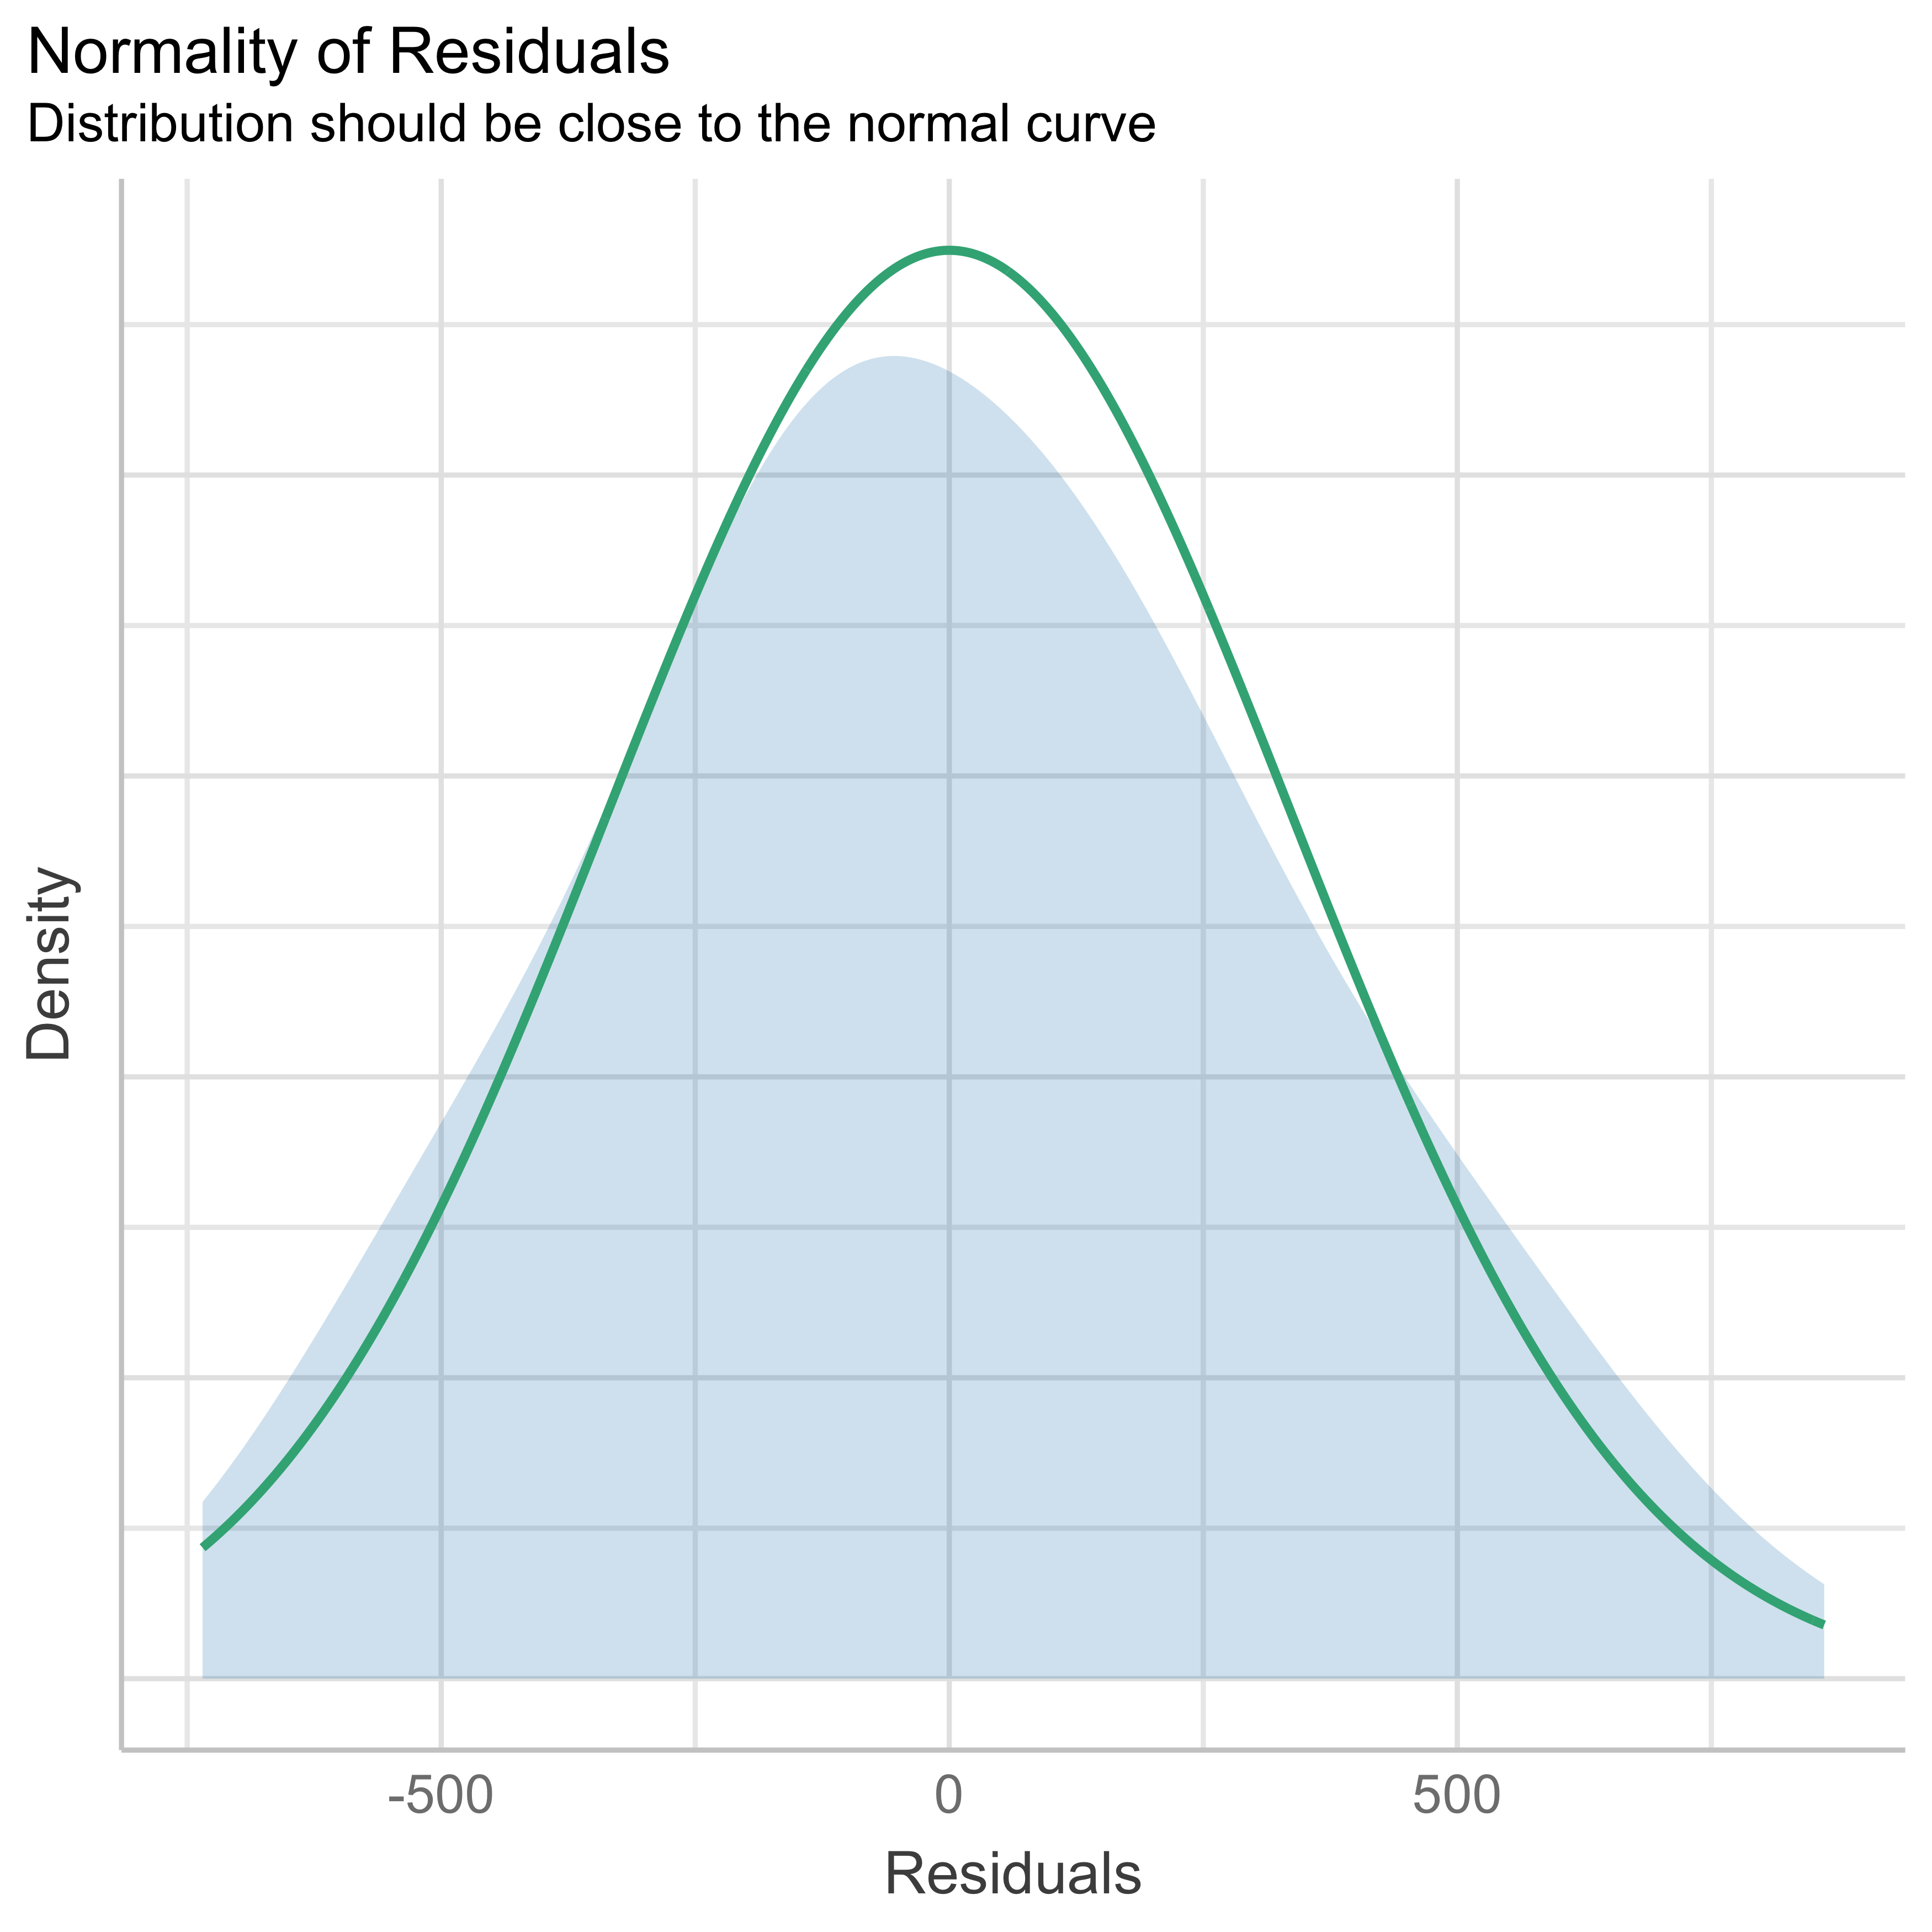
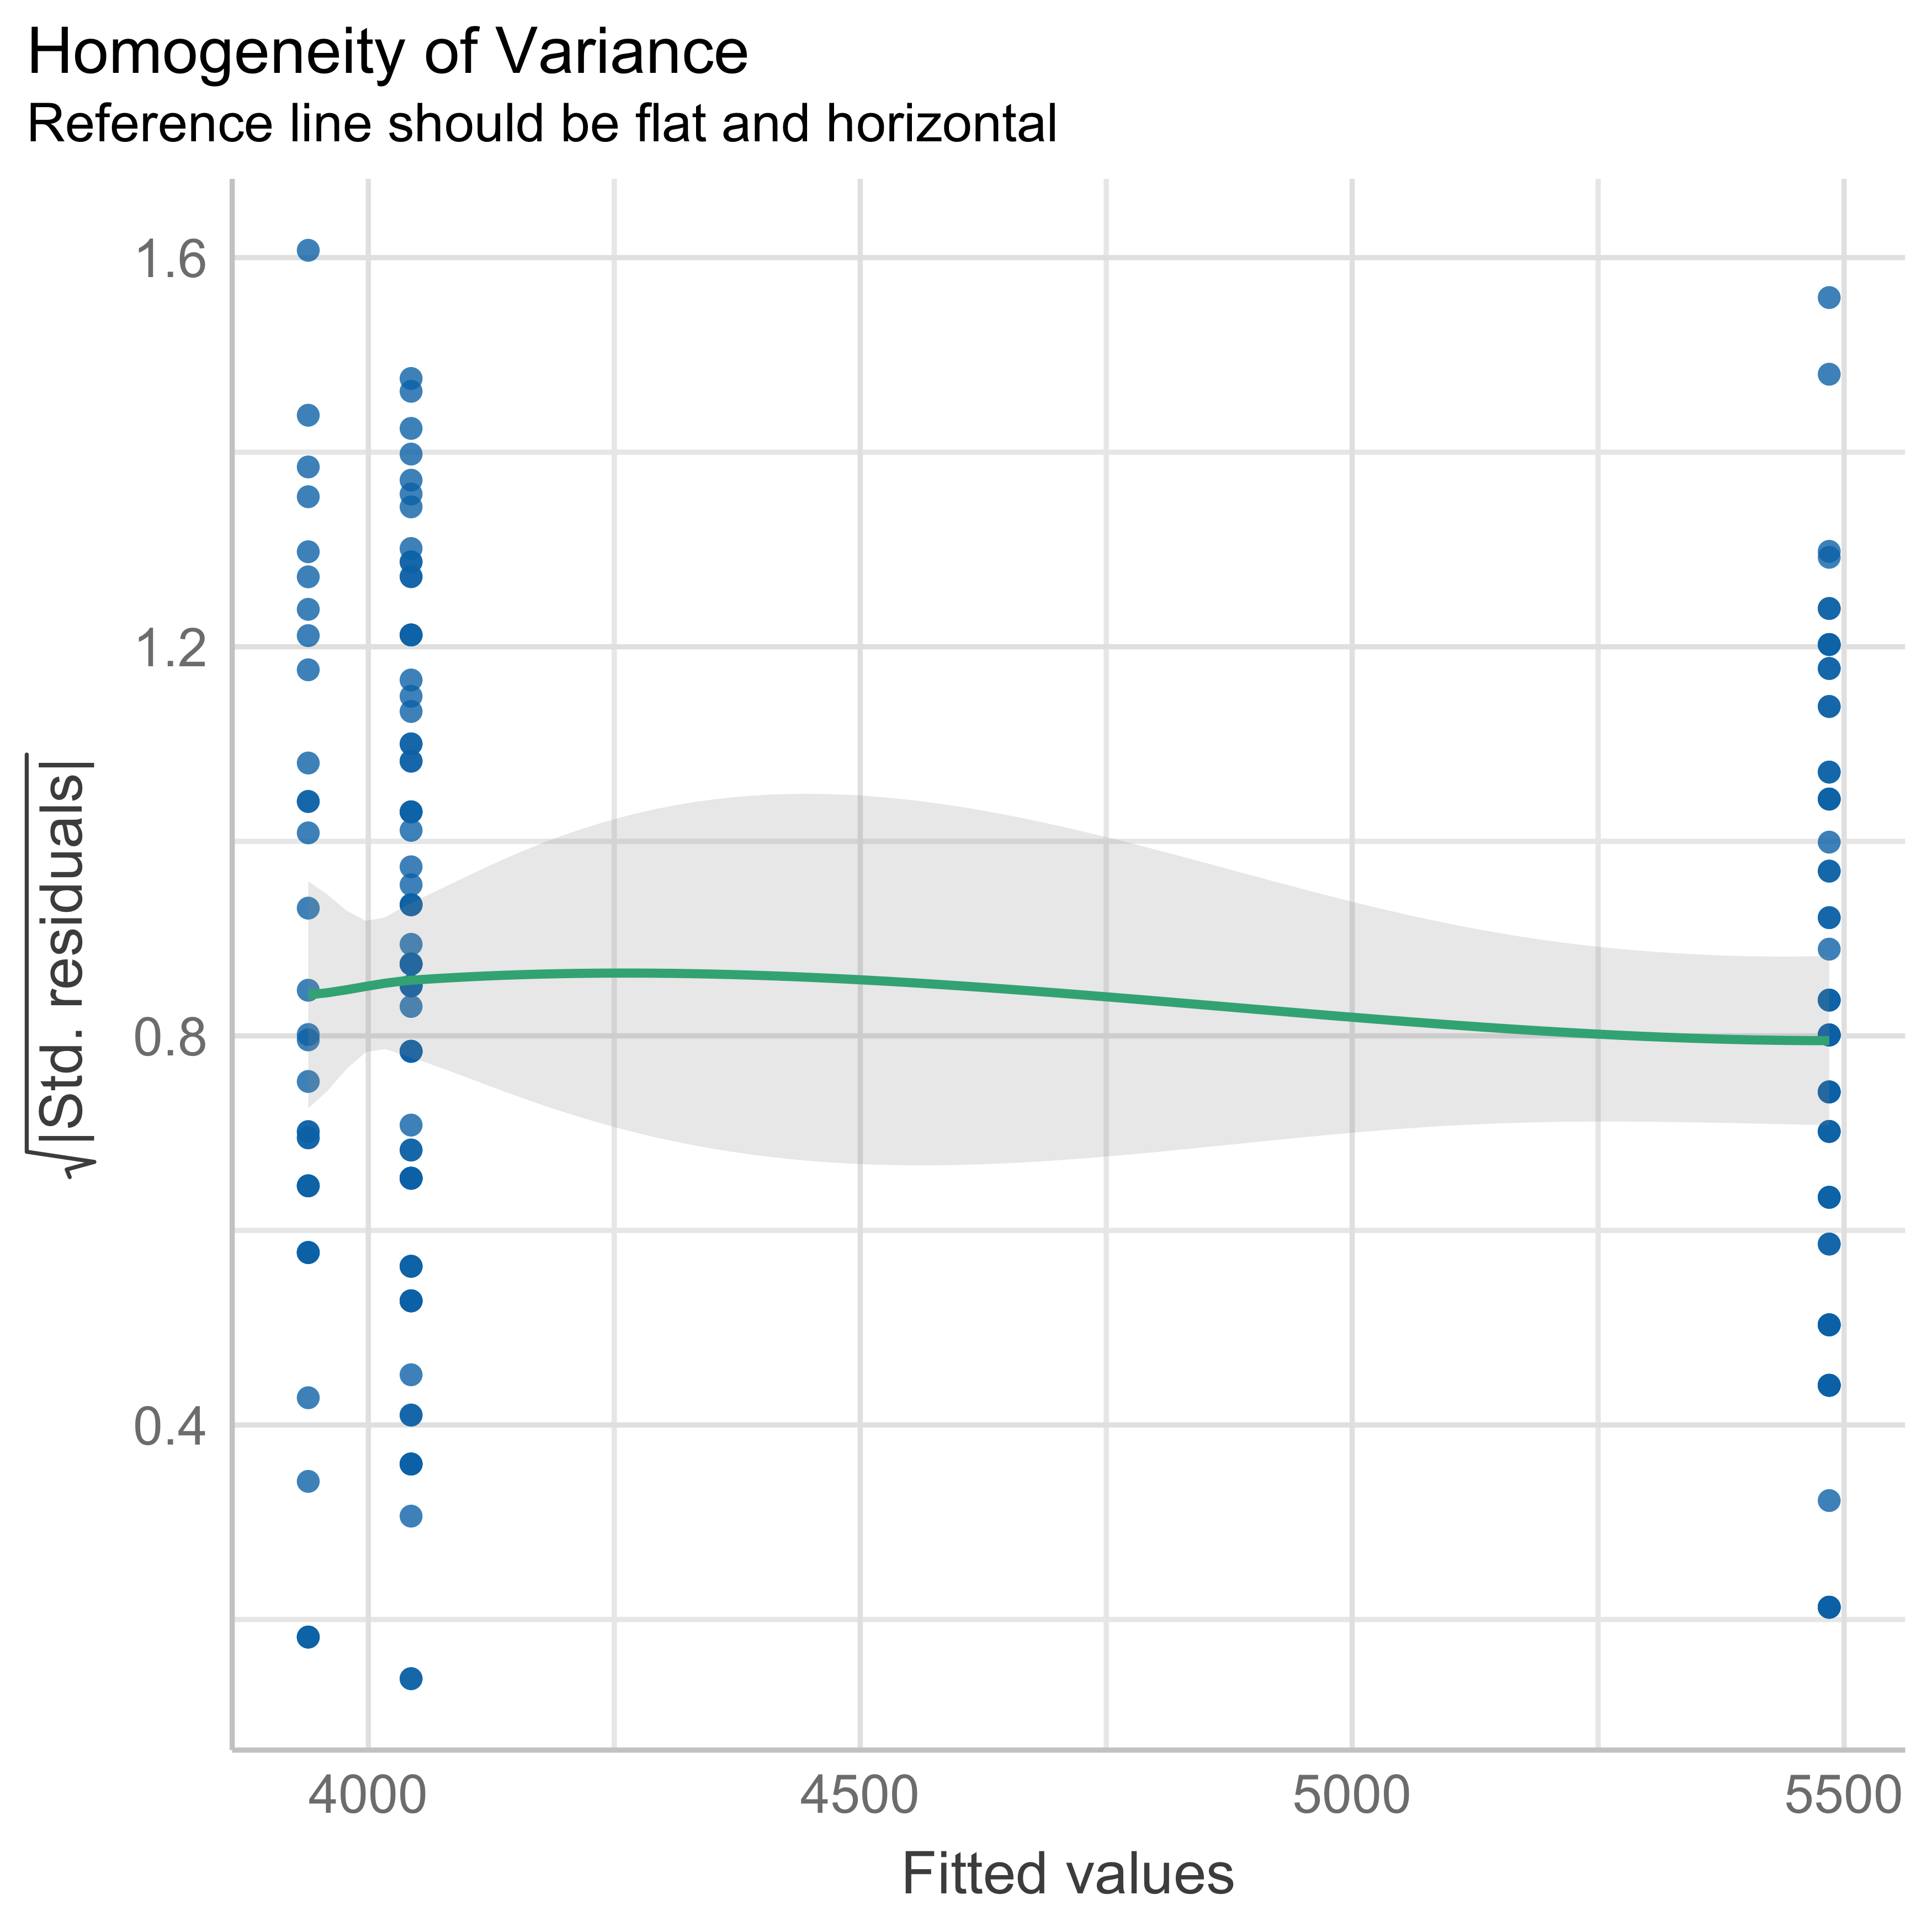
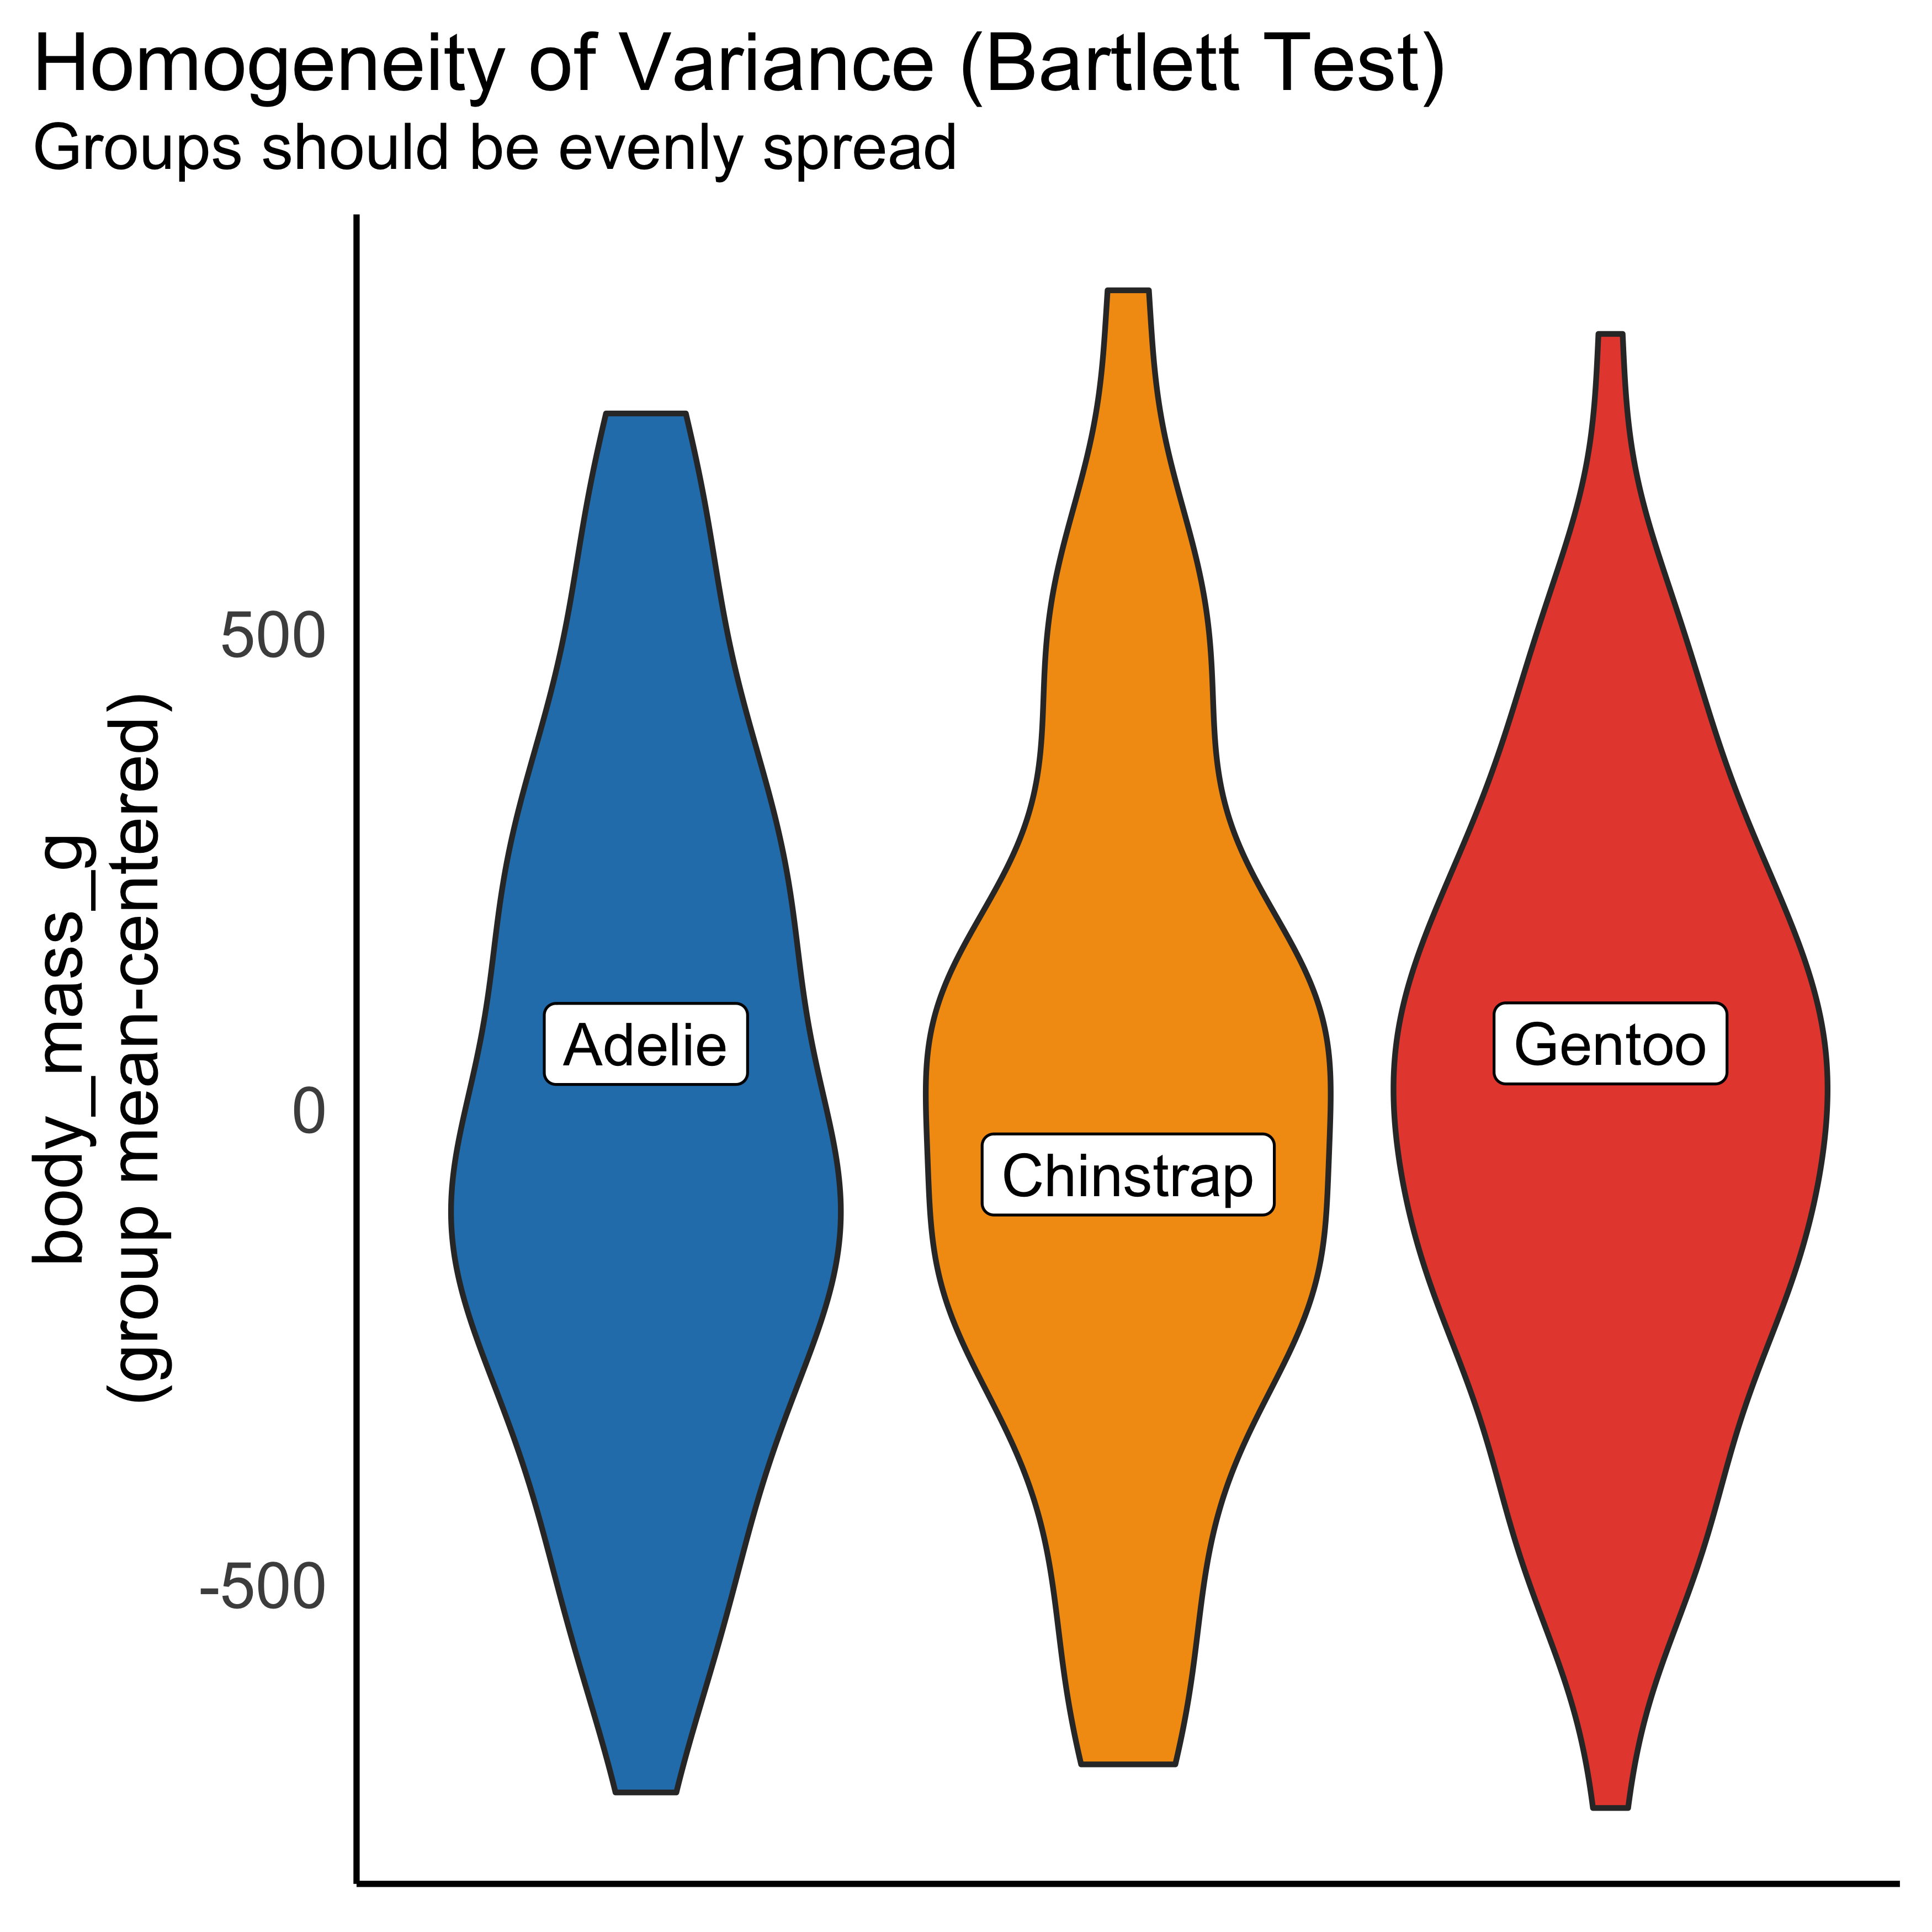
  1. Homogeneity of the variance:
check_heteroskedasticity(anovamodel)
OK: Error variance appears to be homoscedastic (p = 0.322).
plot(check_heteroskedasticity(anovamodel))
plot(check_homogeneity(anovamodel))

Checking influential observations (outliers)

check_outliers(anovamodel)
OK: No outliers detected.
- Based on the following method and threshold: cook (0.5).
- For variable: (Whole model)

What if normality and homogeneity of variance are not met then?

The Kruskal-Wallis test is a non-parametric alternative to the ANOVA test.

kruskal.test(data = males, body_mass_g ~ species)

    Kruskal-Wallis rank sum test

data:  body_mass_g by species
Kruskal-Wallis chi-squared = 116.5, df = 2, p-value < 2.2e-16